


Why do workers still segregate by sex across occupations, industries, and firms? Recent research has focused on how preferences for job amenities, like flexibility, may differ by sex. However, one “amenity” that has received relatively little attention is the sex composition of a job itself. In a recent paper, I conducted a survey experiment to estimate men’s and women’s preferences for sex composition in the workplace. One result is that women and young single men prefer jobs with at least half female coworkers.
Measuring Preferences for Job Amenities
Quantifying worker preferences for job amenities is not straightforward. Using observational data, it is hard to disentangle worker preferences, the cost of providing amenities, and firm hiring behavior. For example, if women are more likely to be in part-time jobs, is that because women prefer working part-time, because it is less costly to offer part-time options in occupations that women perform, or because firms expect that women will be more successful or happy in part-time jobs? Separating these channels is even more difficult when we consider the demographic makeup of a firm as an amenity: sex composition is a direct consequence of both worker choice and firm hiring behavior.
In my paper, I use a hypothetical job choice experiment to measure worker preferences for workplace composition. In the experiment, respondents make several choices between pairs of workplaces where the occupation performed is the same and the job tasks are the same, but the two workplaces differ in wages and demographics. Through this design, I hold constant many attributes that would typically vary with the sex composition of a job, and thus I can estimate preferences for sex composition itself. Respondents make several of these choices across different occupations, including teacher, insurance sales agent, nurse, and software engineer.
Below, I show an example of a choice respondents might make, namely between two jobs as a sales associate at a retail store.
Example Job Choice

The chart below shows the estimated willingness-to-pay (WTP) for sex composition separately for men and women. All WTPs are expressed relative to a 50 percent female workplace. For example, the -3 percent WTP among women for a 10 percent female job means that, on average, the wage in a 10 percent female job must be 3 percent higher than that in a 50 percent female job for a woman to be indifferent between them.
Estimated Willingness-to-Pay for Female Share by Sex
Response to “With Whom Would You Rather Work”
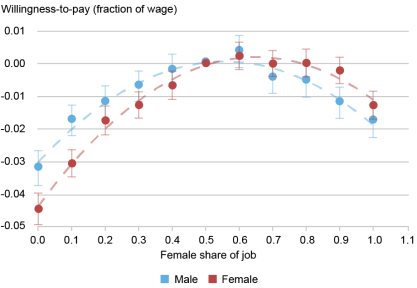
Notes: The chart shows the willingness-to-pay, as a fraction of the wage, for each possible female share estimated on data from the survey. Bars show 95 percent confidence intervals.
Strikingly, the shape of the WTP profile across sex compositions is smooth and remarkably similar for men and women. Women have negative WTPs for jobs less than 50 percent female, indicating that they prefer jobs with a female majority. However, above 50 percent, the WTP curve is mostly flat and even slightly downward sloping, indicating that the value women place on additional female coworkers is negligible once a job is at least 50 percent female.
The pattern of WTPs is similar for men. They have, on average, a negative WTP for majority-male jobs, which decreases in magnitude as the female share approaches 50 percent. However, relative to women, men have a slightly larger negative WTP for majority-female jobs, and most prefer jobs that are evenly balanced by sex. Overall, men’s WTPs for their preferred sex composition are slightly smaller than women’s.
In the accompanying paper, I also examine workers’ WTP for other demographic attributes, including age and parental status. I find that respondents aged 40 and up prefer more coworkers aged 40 and up, and those without children have a slight preference for more coworkers without children.
Preference Heterogeneity
The estimated sex composition preferences vary widely across individuals. The chart below shows the preference estimates from a model that groups respondents into preference classes based purely on their answers to the hypothetical choice questions. (The values in parentheses are shares of the total.) I find that for both women (top panel) and men (bottom panel), about half of respondents seem to have no preference for sex composition at all—they prefer higher-wage jobs and are indifferent to the sex of their coworkers. Another group of men and women prefer majority-female jobs, and dislike majority-male jobs more than the average respondent. Finally, for men, there is a third group that prefers more male coworkers. These results suggest that composition preferences are not homogenous across individuals, so understanding this heterogeneity can be important for understanding the motivations behind these preferences.
Heterogeneous Willingness-to-Pay for Female Share
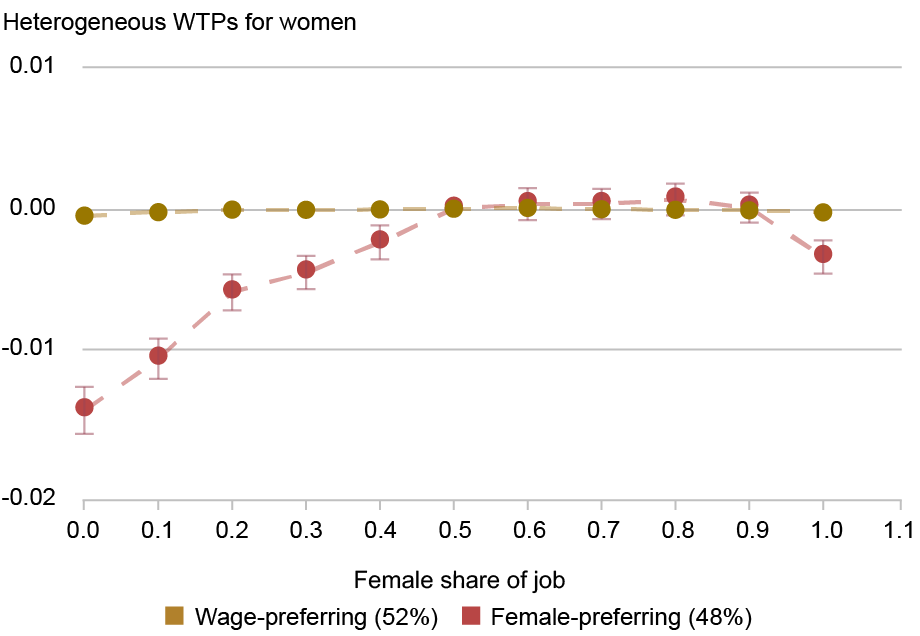
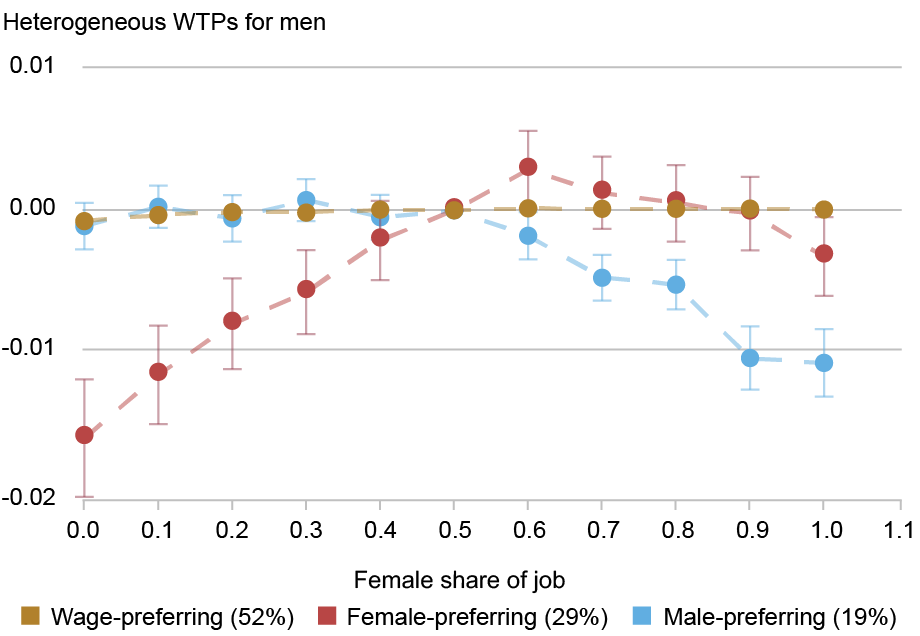
Notes: The top panel of the chart shows the willingness-to-pay (WTP), as a fraction of the wage, for the two classes among women estimated as described in Schuh (2024). The bottom panel shows the same for the three classes among men as described in the paper. The values in parentheses are shares of the total. Bars show 95 percent confidence intervals.
In the paper, I explore how different respondent characteristics vary with their composition preferences. I find that older women are more likely to prefer female coworkers, relative to younger and middle-aged women. Although I cannot distinguish directly from my survey whether this is a cohort effect or an age effect, both possibilities present interesting stories. On the one hand, if it is a cohort effect, it could be that older women experienced a labor market with more restrictive gender norms in the past or may have experienced more gender-based discrimination in the workplace, leading them to prefer more female coworkers. On the other hand, it could be that as women age, their preferences change, or they learn from experience that they prefer female workplaces.
Interestingly, younger, single men are more likely to prefer female coworkers. This suggests that for young men, finding a romantic partner in the workplace may be a motivation for demographic preferences. Coupled with recent research demonstrating both the prevalence of couple formation in the workplace and the potential costs of workplace dating for women, a potential area for further research would be exploring the selection of men into female-dominated jobs and its effect on female workers’ welfare.

Rachel Schuh is a research economist in the Federal Reserve Bank of New York’s Research and Statistics Group.
How to cite this post:
Rachel Schuh, “What Workplace Composition Are Job Candidates Looking For?,” Federal Reserve Bank of New York Liberty Street Economics, February 19, 2026, https://doi.org/10.59576/lse.20260219
BibTeX: View |


Disclaimer
The views expressed in this post are those of the author(s) and do not necessarily reflect the position of the Federal Reserve Bank of New York or the Federal Reserve System. Any errors or omissions are the responsibility of the author(s).
 RSS Feed
 Follow Liberty Street Economics