It’s been said that if you want to know how the economy is doing, look at how many people are carrying shopping bags. That adage may not hold so well today. The rise of the internet and e-commerce over the past two decades has chipped away at the market share of “brick and mortar” retailers. But it’s only been in the past few years that this shift in market share has had a noteworthy effect on retail employment. In this post, we focus on national and local employment trends in two categories of retail—department stores and nonstore retailers—and try to assess how the surge in online shopping has affected local labor markets across the United States.
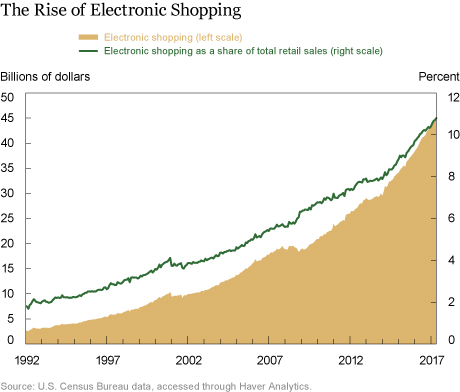
First, let’s look at trends in online retail sales over the past two decades. As shown in the chart below, online sales have grown strongly, with their share of total retail sales increasing from 2.5 percent in the mid-1990s to around 5 percent in the mid-2000s, then doubling again to exceed 10 percent today.

Next, let’s look at employment trends for traditional retailers and nonstore retailers. Since total retail employment includes job figures for gas stations, auto dealers, and other establishments that are less exposed to the e-commerce wave, we will focus our comparison here on department stores—a category of retail that employs a lot of people and seems particularly susceptible to competition from the internet. In addition, department stores have seen steeper job losses than other types of retailers in recent years and may be among the most vulnerable to the rise of online shopping.
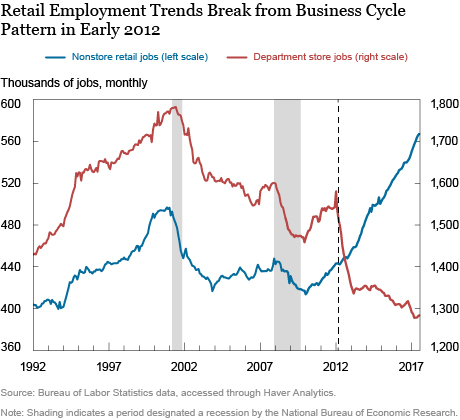
As the chart below illustrates, employment at both department stores and nonstore retailers cycled up and down with the economy until early 2012. At that point, however, there was an abrupt shift: the two series began moving in opposite directions. That year, department stores slashed over 200,000 jobs on net, while nonstore retail employment rose by a small fraction of that figure. Since early 2013, department stores have eliminated roughly 80,000 jobs, on net, while nonstore retailers have added roughly 100,000. Both of these trends show no sign of abating and, if anything, recent reports of widespread department store closings—such as these from March, May, June, and July—suggest that this pattern may be intensifying in 2017.

The overall employment picture is not all bad. While department stores have been shedding jobs, other segments of the retail sector have posted steady to rising job counts. Moreover, as noted above, much of this churn is just a shift of jobs from one industry to another: over the past year, nonstore retailers have added almost as many jobs (29,000) as department stores have cut (32,000). So why should this be a concern? One reason is that the geographic distribution of jobs is very different for online retailers versus brick-and-mortar outfits. In other words, areas that are losing a lot of department store jobs may not be the ones gaining online retail jobs.
Department stores have an incentive to spread out their staff in proportion with the distribution of the general population: because they do their business in person and there is demand for their products throughout the country, they employ people everywhere.
Online retailers don’t have the same geographic constraints—that is, they don’t have to be where their customers are to make a transaction. In this sense, they are more like wholesale distributors. In contrast with traditional retailers, online sellers tend to concentrate all or most of their staff in one or a few locations: it is more expensive to have people all over the place if they don’t need to be. Although the largest online retailers do have multiple distribution centers around the country, they still tend to have considerably fewer locations than the largest department store chains. Though total employment across department stores and e-tailers combined has not changed much at the national level since late 2012, there have been significant differences across counties: the areas that are losing department store jobs are often not the same ones gaining nonstore jobs.
To examine these trends more closely, we looked at local employment data across the fifty states, as well as in Washington, D.C., and Puerto Rico. We were able to analyze detailed retail industry employment data for roughly 700 counties, areas that account for 82 percent of jobs nationwide. Such data are not available for more than 2,000 rural counties, however; to include those areas in our analysis, we have combined statistics on rural counties by state. In New York, for example, we had detailed data for only thirty-five of the state’s sixty-two counties, so we combined the other twenty-seven into one area, which we can think of as a really big, sparsely populated county. When these amalgamations are added in, we have a nationwide data set spanning 742 “counties” (as we will call them for simplicity).
Between 2012 and 2016, 561 (about 75 percent) of the counties we studied lost department store jobs. While a majority of those counties did see some increase in nonstore retail jobs, four-fifths of these counties lost out on net—that is, department stores shed more jobs than nonstore retailers added. Of those counties that came out ahead—that is, gained more in nonstore retail jobs than they lost in department store jobs—some came out way ahead: none did better than King County, Washington, home of Amazon.com. In 2012, King County’s nonstore employment represented 1.4 percent of the total employment in the county; by 2016, that share had doubled to 2.8 percent. This seems especially remarkable since, at the national level, nonstore retail jobs had merely edged up from 0.4 percent of total employment to 0.5 percent during the same period.
But simple job counts are not the only relevant measure of labor market conditions. How do the jobs being lost at department stores compare to those being gained in online retailing? For people who lose department store jobs, is finding a new job simply a matter of relocating to areas where there are lots of nonstore job openings?
If wages are a rough proxy of employers’ demand for certain skillsets, then these two categories of jobs would seem to have different skill requirements: in 2012, the average online retail job paid slightly over $50,000, while the average department store job paid just $20,500. By 2016, the average wage for nonstore workers exceeded $59,000, while the average wage for department store workers remained roughly the same. Part of this pay gap reflects the fact that department store jobs are more likely to be part-time. Nevertheless, the difference is staggering, suggesting that nonstore retailers demand a different type of worker than department stores do. So, even if laid-off department store workers were willing and able to move to, say, King County, they might lack the skillsets sought by e-tailers.
What Does This Mean for Job Growth across Counties?
As we’ve seen, many counties with steep declines in department store employment have not seen much, if any, offsetting gain in nonstore retail jobs. Moreover, these counties tend to be less urban and have lower levels of income. However, there does not seem to be much of a correlation between department store job losses and trends in overall employment; in other words, counties with sizable declines in department store jobs are not predominantly counties that are doing poorly in general. It remains to be seen how the widespread retail closures announced in 2017 break out geographically.
Of course, it is important to remember that the labor market effects of online retailing go well beyond the retail sector. A more thorough analysis would consider the indirect effects of e-commerce on warehousing, local freight trucking, and couriers and messengers—three industries that have seen fairly robust job growth in recent years. Moreover, these types of jobs would likely be distributed a bit more evenly across the country. And finally, the trend toward online shopping may enable small manufacturers to flourish pretty much anywhere: given the ability to deal directly with customers, they would no longer need to develop distribution networks or build large inventories.
Disclaimer
The views expressed in this post are those of the authors and do not necessarily reflect the position of the Federal Reserve Bank of New York or the Federal Reserve System. Any errors or omissions are the responsibility of the authors.

Jason Bram is an officer in the Federal Reserve Bank of New York’s Research and Statistics Group.

Nicole Gorton is a senior research analyst in the Bank’s Research and Statistics Group.
How to cite this blog post:
Jason Bram and Nicole Gorton, “How Is Online Shopping Affecting Retail Employment?,” Federal Reserve Bank of New York Liberty Street Economics (blog), October 5, 2017, http://libertystreeteconomics.newyorkfed.org/2017/10/how-is-online-shopping-affecting-retail-employment.html.


 RSS Feed
 Follow Liberty Street Economics
Taylor: Thanks for your interest in our blog post and for your comment. In response to your question, for Department Store employment we used NAICS 4521 (not all of 452, which includes a broader set of “general merchandise” stores). The data by county is from the BLS’ QCEW data set, which you can find here: https://data.bls.gov/cew/apps/data_views/data_views.htm#tab=Tables
Thank you for posting. I was curious to learn more about the methodology used for the department store employment figures; I can replicate the data for non-store employment (NAICS No. 454) but having difficulty doing the same for department stores (NAICS No. 452). Was the department store employment data (Fig 2) for those (700) counties in your geographic study only?