Editor’s note: The labels on the y-axis of the chart “Nonfarm Business Sector: Real Output per Hour of All Persons” have been corrected. (June 26, 2017, 11:56 a.m.)
A major economic concern is the ongoing sluggishness in the growth of output per worker hour, generally called labor productivity. In an arithmetic sense, the growth of the economy can be accounted for by the increase in hours worked plus that of labor productivity. With the unemployment rate now at a level widely regarded as near “full employment,” growth in hours worked is likely to be limited by demographic forces, most importantly the very limited expansion of the working-age population. If productivity growth also remains low, the sustainable pace of increase of real GDP will be limited and remain noticeably lower than historic norms.
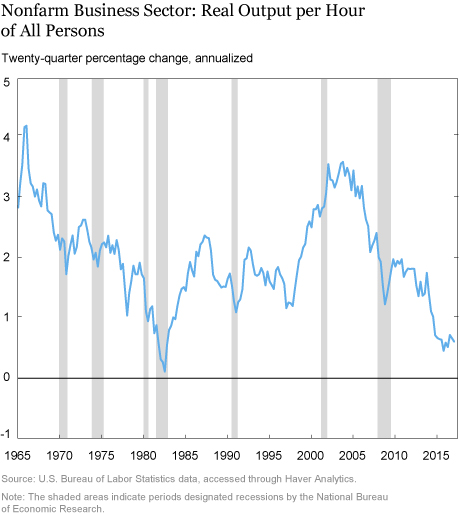
Productivity growth numbers are highly volatile, both on a quarterly basis and on an annual basis. The chart below looks at the series over a five year, or twenty quarter, horizon—a period that smooths out much of the volatility. We see that the recent figure is less than 1 percent, a level not seen since the depths of the deep 1981-82 recession. The New York
Fed’s Kahn-Rich model, using a more sophisticated statistical method, confirms that the current productivity trend is low, though the point estimate coming from this model is a bit over 1 percent—still much lower than the historical average.
Why is productivity growth so low? Economists point to three factors that affect productivity: (1) the growth of the skill set of the workforce, (2) the growth of basic technological and management knowledge, and (3) the growth of capital per worker.
Worker skills are generally associated with education levels, and the data suggest that there has been, and is likely to be for some time, little net increase in education levels in the workforce. Although a large share of today’s entering workers have college degrees, they are replacing retiring workers (baby boomers) who are also well-educated. In the 1970s and 1980s, new workers were typically better educated than those leaving the workforce, suggesting that the average skill set was improving.
Growth of pure technological and managerial knowledge is much harder to observe (in fact, it’s typically interpreted as the portion of productivity growth that can’t be directly credited to improved worker skills or capital formation). It’s difficult to infer what this factor is likely to do: some observers claim that, say, increased application of artificial intelligence will lead to a marked acceleration of productivity, while others assert that there’s little reason to believe that such factors will add as much to productivity as seemingly humbler innovations of the past (such as, say, the adoption of containerization by the transportation sector in the 1960s).
That leaves capital formation as the remaining factor affecting productivity. Workers need tools to do their jobs; the more tools per worker, the more the workers can produce (at least to a point!). As a result, one important factor to examine in assessing productivity trends is the growth of capital per hour worked.
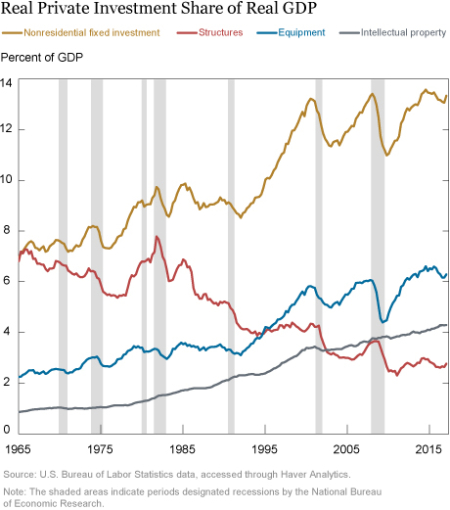
The net capital stock grows when physical investment is larger than the normal deterioration of capital in use—that is, depreciation. In the data, “capital” includes not only physical goods, but also intellectual products such as software and estimates of the values of R&D knowledge, copyrights, and patents—the investment numbers also include all these products. The chart below shows data on the investment share of GDP, in chained 2009 dollars. The chart shows the increasing importance of investment in intellectual products, most notably relative to structures. In any event the current aggregate investment share seems relatively high, which might suggest a decent trend for the growth of capital per worker.
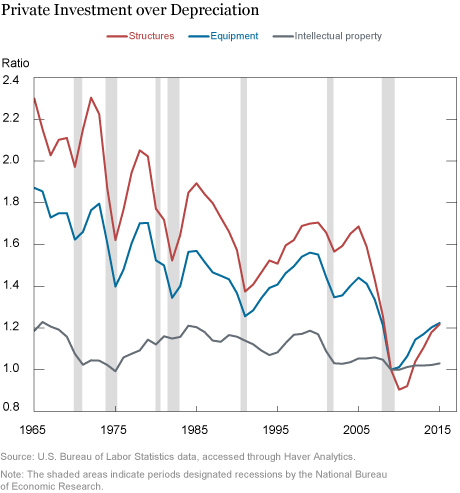
However, the gross investment numbers are a bit deceiving. Both equipment and intellectual capital tend to be short-lived (think how often computers and software are upgraded), while structures are quite long-lived. The increase in investment in short-lived products relative to investment in long-lived products means that depreciation of the total private business capital stock has been increasing over time. Indeed, the chart below shows that relative to depreciation, investment has been weak in this expansion. (Note, a value of one in the following chart means that gross investment equals depreciation, so the net capital stock would be unchanged over time. A value greater than one indicates that gross investment exceeds depreciation and so the net capital stock would grow. Conversely, a value below one indicates that gross investment is less than depreciation and so the capital stock would shrink.)
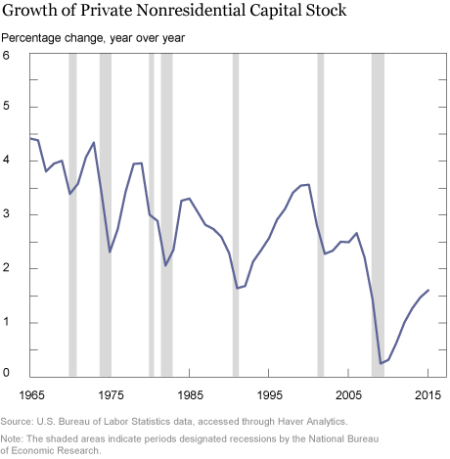
The result, shown in the chart below, is that despite some improvement in the most recent years, growth in the aggregate private capital stock (net of depreciation) has also been low. In other words, for the aggregate net stock of private business capital to grow at rates seen in the past, aggregate gross investment would have to be higher as a share of GDP than it is currently due to the increase in short-lived investment.
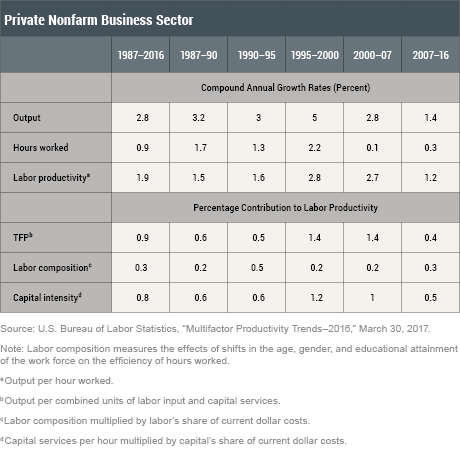
Economists who study productivity use substantially more detailed data on investment and make sophisticated estimates of the effect on output of different types of capital used in all U.S. industries. Their analysis is presented in forms such as the table below. The row labeled “capital intensity” can be said to reflect the effect of current and past physical investment on the growth of labor productivity (“labor composition” is related to skill set improvements, and total factor productivity [TFP] should include the effect of pure technological and managerial improvement). The 0.5 percent growth contribution for “capital intensity” estimated for the period from 2007 through 2016 is less than half that seen in the periods from 1995-2000 and 2000-2007. The slowdown can be largely attributed to the sluggishness in net investment.
There are surely many factors that have contributed to the pronounced slowdown of growth of labor productivity. Given the complex set of forces that affect productivity, projecting its medium-term trend is problematic. Still, data suggest capital formation has played a role and the odds of a rebound in productivity are reduced if the weakness in investment spending continues.
Disclaimer
The views expressed in this post are those of the authors and do not necessarily reflect the position of the Federal Reserve Bank of New York or the Federal Reserve System. Any errors or omissions are the responsibility of the authors.
 Richard Peach is a senior vice president in the Federal Reserve Bank of New York’s Research and Statistics Group.
Charles Steindel is a resident scholar at the Anisfield School of Business, Ramapo College of New Jersey.
How to cite this blog post:
Richard Peach and Charles Steindel, “Low Productivity Growth: The Capital Formation Link,” Federal Reserve Bank of New York Liberty Street Economics (blog), June 28, 2017, http://libertystreeteconomics.newyorkfed.org/2017/06/low-productivity-growth-the-capital-formation-link.html.


 RSS Feed
 Follow Liberty Street Economics
This is an important analysis that deserves more attention.