This morning, New York Fed President William Dudley spoke to the press about the growing resilience of the U.S. household sector. His speech was followed by a briefing by New York Fed economists on developments in household borrowing. Their presentation included a detailed decomposition on mortgage borrowing and payment trends, and some new research on how borrowing has evolved differently across age groups. Today, the New York Fed also released the Quarterly Report on Household Debt and Credit for the fourth quarter of 2015. The report, the press briefing
, and the following analysis are all based on the New York Fed Consumer Credit Panel, which is itself based on consumer credit data from Equifax.
Balances
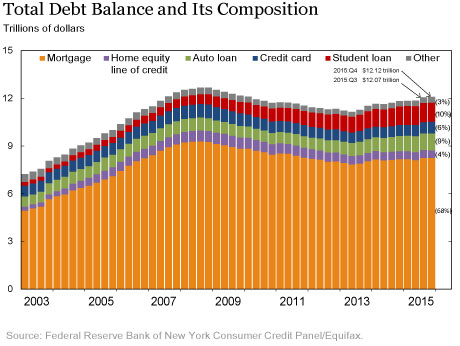
Household debt balances increased, albeit sluggishly, throughout 2015. The increase marked the third consecutive annual rise in household balances, after 2013’s modest increase ended four years of reductions. However, the growth in debt has been moderate. Overall, balances owed by households grew $288 billion in 2015, slightly less than the $306 billion increase seen in 2014 and still less than the growth seen in the early 2000s.
The growth has been primarily the result of large increases in nonhousing balances, particularly in student and auto loans; auto loans had another banner year in 2015 with a $109 billion increase, while student loans increased by $75 billion. Credit card balances increased by $33 billion. Originations were robust for auto loans, which saw the highest level of originations since at least 1999. Newly originated mortgage balances remained somewhat sluggish, with the lion’s share of new mortgages going to borrowers with the highest credit scores.
Repayment Behavior
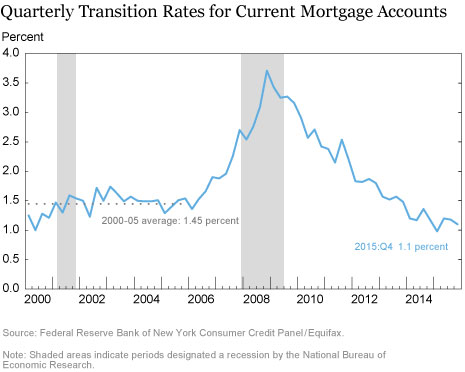
In 2015, we saw continued improvement in the overall delinquency rate, driven by mortgage debt. The improvement stems partly from an extremely low flow of mortgages into delinquency, as shown in the chart below, which plots the quarterly transition rate for current mortgage balances into delinquency. The transition rate fell to 1.1 percent in the fourth quarter of 2015, a considerable improvement from the end of 2008, when 3.7 percent of current mortgage balances transitioned into delinquency, and even lower than the average transition rate of 1.45 percent seen between 2000 and 2005. Consequently, new foreclosures in 2015 were the lowest observed in the seventeen-year history of our data.
Since mortgages are the largest component of household debt, they have an outsized effect on the overall delinquency rate. Delinquency rates for nonhousing debts remained roughly level with the rates observed at the end of 2014.
Deleveraging Update
So why aren’t mortgage balances increasing, given the rise in house prices and a modest pickup in new mortgage originations during the past few years? We’ll get to a bit of that here, with an update to the framework decomposing the change in aggregate balances, which we first described in March 2011 and have updated three times since, most recently in November 2014, when our framework indicated that the deleveraging process was mostly over.
Mortgage Balances
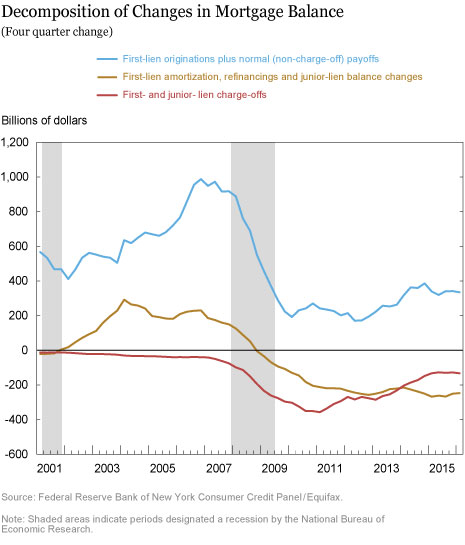
The chart below presents an updated decomposition analysis extending through the fourth quarter of 2015.
- The red line shows that charge-offs from first- and junior-lien mortgages remain larger than before the recession and continue to reduce balances, gradually lessening any remaining backlog of existing foreclosures.
- The blue line represents the changes in balances from housing transactions. Although this line has picked up somewhat, it remains below the level seen in the early 2000s, perhaps reflecting continued tightness in the mortgage market even as house prices finally approach the levels seen at the peak and home sales pick up from the very low post-crisis levels.
- The gold line measures net paydowns of mortgages: the combination of cash-out refinancings, changes in junior-lien balances, and regular amortization of first-lien balances. The steady net paydown of mortgage balances from these forces has continued.
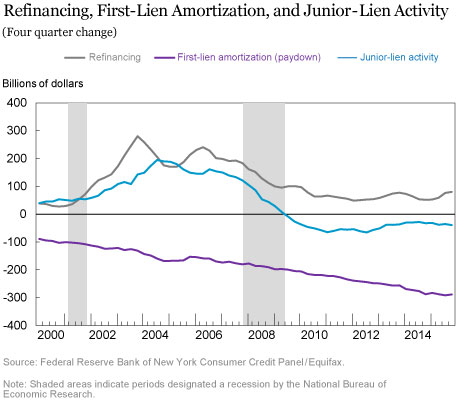
We can get a bit more insight by breaking the gold line into three components. In gray, below, we show refinancing activity. In aggregate, refinancings tend to be associated with some cash out, although we see that the degree to which borrowers are exercising this option has shrunk significantly in the post-crisis years. Even the 2013 refi boom gave only a modest boost to this. The turquoise line shows junior-lien balance activity. With home equity lines of credit less easily available, many of these accounts are in repayment, without enough new originations to offset the effect of the repayments. Finally, in purple, we show the amortization (scheduled paydowns) of first-lien mortgages. Because payments reduce the balance, this line is always negative, but the magnitude changes over time, and has been steadily growing.
Stay Tuned . . .
In the next few weeks, we’ll feature two new posts on Liberty Street Economics that highlight material from today’s press briefing. The first of these posts will take a closer look at the causes and consequences of how mortgages have changed. The second post will examine the changing age profile of American borrowers as baby boomers reach retirement and millennials find their footing.
Disclaimer
The views expressed in this post are those of the authors and do not necessarily reflect the position of the Federal Reserve Bank of New York or the Federal Reserve System. Any errors or omissions are the responsibility of the authors.
 Meta Brown is a senior economist in the Federal Reserve Bank of New York’s Research and Statistics Group.
 Donghoon Lee is a research officer in the Bank’s Research and Statistics Group.
 Andrew Haughwout is a senior vice president in the Federal Reserve Bank of New York’s Research and Statistics Group.

Joelle Scally is the administrator of the Center for Microeconomic Data in the Bank’s Research and Statistics Group.

Wilbert van der Klaauw is a senior vice president in the Bank’s Research and Statistics Group.


 RSS Feed
 Follow Liberty Street Economics
Very informative work.