Correction: The source notes for the charts in this post were incomplete and have been corrected. We regret the error.
Personal bankruptcy was introduced in the United States through the Bankruptcy Act of 1978. After passage of the act, bankruptcy rates rose steadily until 2005, when Congress passed the Bankruptcy Abuse Prevention and Consumer Protection Act (BAPCPA). BAPCPA was signed by President George W. Bush on April 20, 2005, and applied to bankruptcy cases filed on or after October 17, 2005. The reform caused a large and permanent reduction in bankruptcy filings. In this post, we study the mechanism behind this drop and the consequences for households.
Households in financial distress have the option of filing for bankruptcy. Upon filing, debtors obtain immediate relief from all collection efforts, including lawsuits, wage garnishments, and direct communications from creditors. Chapter 7, or “fresh start,” bankruptcy is the most commonly used procedure, accounting for 70 percent of all filings. Assets exceeding certain exemption levels are used to satisfy unsecured creditors and the rest of the debts are discharged. Under Chapter 13, filers keep all of their assets but must use their future income to repay part of their unsecured debt. Most unsecured debt is dischargeable under either chapter, excluding most taxes, student loans, alimony and child support obligations, and debt obtained by fraud. Bankruptcies remain on a debtor’s public record for seven years (Chapter 13) or ten years (Chapter 7).
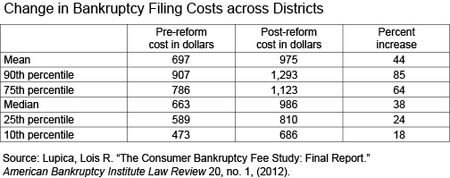
BAPCPA introduced several major changes to the bankruptcy code that increased the burden, monetary and otherwise, of filing for bankruptcy protection. Among the most notable of the new features are an income “means test” that determines eligibility for filing for Chapter 7 bankruptcy; elimination of the option for filers to propose their own Chapter 13 plans; new standards against fraud that render attorneys liable for the accuracy of claims; and mandatory credit counseling for filers. These requirements substantially increased the documentation burden associated with filing. There was also a substantial rise in the monetary cost of filing, with a median increase of 38 percent in attorney fees, which account for 75 percent of the cost of filing.
To assess the implications for BAPCPA, we estimate the transition probabilities of individuals across various credit states. These estimates give us an indication of the timing and overall magnitude of the response. We find that the 2005 reform is associated with a drop in bankruptcy and increases in both insolvency and foreclosure immediately after the introduction of the law. We also show that these effects are much larger for low-income individuals and for those in court districts that experienced the largest increases in filing costs. We interpret these results as being consistent with the hypothesis that liquidity constraints—that is, the inability to afford the higher cost of bankruptcy—were responsible for the reduction in bankruptcy filings. We also show that insolvency is associated with a higher degree of financial distress compared to bankruptcy, suggesting that the reform may have been negative for households.
Mechanism behind the Drop in Bankruptcies
We assess the impact of the reform by estimating the frequency transition probabilities of individuals across different credit states over time. To do so, we use the FRBNY Consumer Credit Panel (described here). We identify a set of mutually exclusive and exhaustive credit states, which include Bankrupt (either chapter), Insolvent (individuals with accounts that are 120 or more days late or charged off), Delinquent (those with accounts 30, 60, or 90 days late who are not insolvent), and Current. We include each of these states with and without the foreclosure flag. We start from Delinquent and look at the four-quarter-ahead transition probabilities into other states.
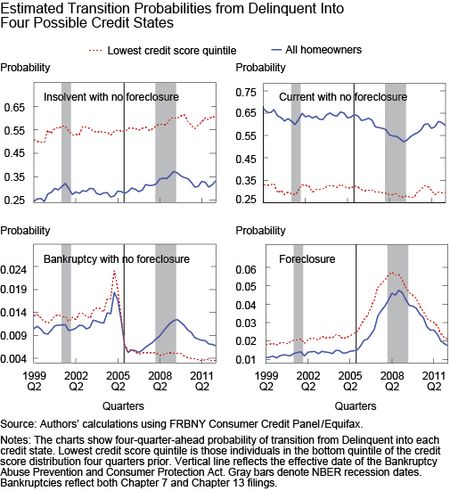
The charts below present the estimated transition probabilities into four of the possible states, specifically Insolvent, Current, Bankrupt without foreclosure, and Foreclosure. The blue lines correspond to the overall population, while the dashed red lines correspond to the first quintile of the credit score distribution (that is, the lowest credit score quintile), where the credit score is measured four quarters prior to the estimated transition. The vertical line corresponds to the first quarter of implementation of the reform.
For the overall population, there is a large and persistent drop in the transition probabilities into Bankrupt and into Current without foreclosure, and a sharp rise in the transition probability into Insolvent without foreclosure, at the implementation of the reform. There is also a sharp rise in the transition probability into Foreclosure.
For the bottom quintile of the credit score distribution, the transition into Bankrupt, which is about 3 percentage points higher than in the overall population prior to reform, drops by more and does not respond at all to the 2007-09 recession and the financial crisis. The transition probability into Insolvent rises by a similar percentage for the overall population and for the bottom quintile of the credit score distribution. This suggests that individuals with low credit scores are not filing for bankruptcy despite facing financial distress. As for the overall population, there is a drop in the transition probability into Current and a sharp rise in the transition into Foreclosure.
The fact that the response to the bankruptcy reform is much more pronounced for individuals with low credit scores, together with the large rise in the monetary cost of bankruptcy associated with the reform, suggests a natural explanation for the mechanism that leads to the drop in bankruptcy filings—that is, the presence of liquidity constraints.
We support this hypothesis in two ways. First we show that individuals with low credit scores have lower income relative to other individuals. We then proceed to exploit the sizable cross-district variation in the rise in filing costs, and show that a larger rise in filing costs is associated with a bigger decline in bankruptcy and a larger rise in insolvency and foreclosure.
For the first step, we supplement the Consumer Credit Panel with payroll data from a large income-verification firm. These data are available for 2009 and link individual labor earnings to information on the individuals’ credit files. We have approximately 11,000 such linked records. Based on these data, the probability that an individual with a credit score in the lowest quintile has income in the lowest quintile of the income distribution is 0.36. The probability that his or her income is in the bottom 40 percent of the income distribution is 0.62, whereas the probability that his or her income is in the top 40 percent of the income distribution is 0.17. This confirms the positive relation between income and credit score.
We now turn to the variation in filing costs across court districts as well as the change in these costs associated with the reform. Summary statistics on these costs are presented in the table below.
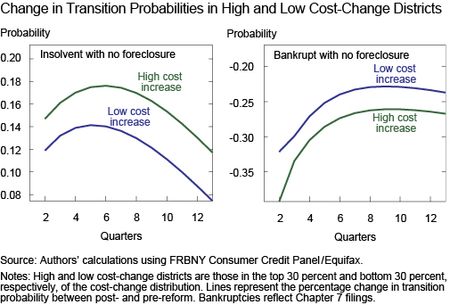
To explore the role of the cross-district variation in cost changes, we estimate the transition probabilities for high cost-change and low cost-change districts, defined as the top 30 percent and bottom 30 percent in the cost-change distribution. We present the transition probabilities at all horizons in the chart below. Each line represents the percentage change in the transition probability between post- and pre-reform. Clearly, the rise in the transition into insolvency and the decline in the transition into bankruptcy are larger for high cost-change districts.
The differential response to the reform for individuals of different incomes in districts with different percentage changes in the filing costs provides strong evidence that the response to the reform was driven by liquidity constraints—that is, the inability to pay the bankruptcy fees.
Insolvency versus Bankruptcy: Does It Matter?
We have shown that the 2005 bankruptcy reform led to a sizable increase in insolvency. The question is, does it matter? If insolvency is essentially equivalent to bankruptcy, we could conclude that the rise in insolvency is inconsequential. Using the Consumer Credit Panel, we examine additional indicators of financial distress, as well as the rate of access to new lines of credit for individuals who go bankrupt and those who just remain insolvent. We also examine the evolution of these individuals’ credit scores.
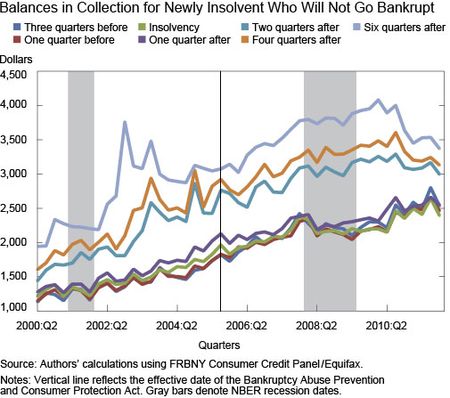
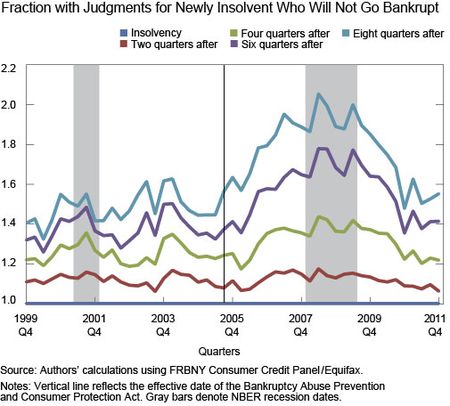
We first consider balances in collections and court judgments. The latter originate from unpaid alimony, medical debt, and wage garnishment orders. We consider cohorts of individuals who become insolvent at a given quarter after a two-year spell with no insolvency, and we separate them based on whether they do or do not go bankrupt in the eight quarters after their insolvency. We examine them for sixteen quarters around the date in which they become insolvent.
As can be seen in the charts below, both the balances in collection and the fraction of individuals with court judgments grow after insolvency for individuals who do not go bankrupt, whereas bankruptcy filing immediately stays collection efforts and court judgments.
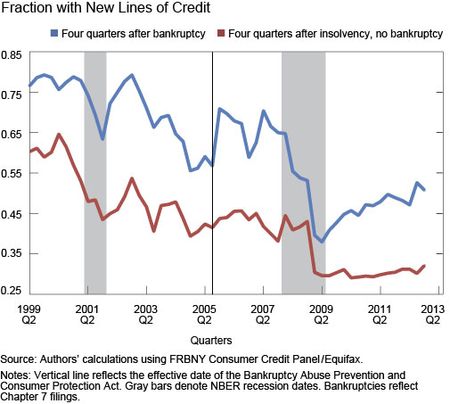
We now turn to new unsecured accounts. For each quarter, we present the average number of new unsecured accounts four quarters later for individuals who become insolvent in that quarter but will not go bankrupt, compared to individuals who go bankrupt in that quarter. Clearly, individuals who do go bankrupt open a larger number of new unsecured accounts. Since the number of inquiries is very similar across the two groups, this outcome is not driven by difference in demand for new accounts, but rather by difference in access to credit.
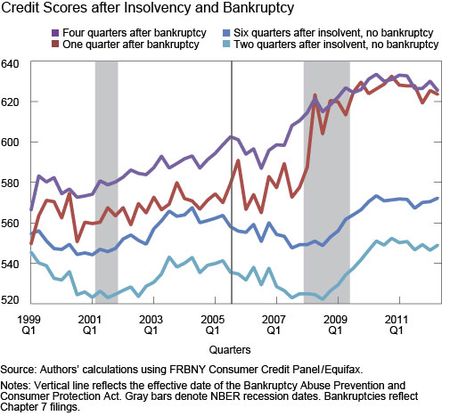
Finally, we consider credit scores. Among the newly insolvent, throughout the sample period, the individuals who do go bankrupt have lower credit scores than those who do not go bankrupt, which is consistent with them having a higher default risk. The chart below presents the credit scores of these individuals several quarters after they become insolvent. The lowest lines correspond to the individuals who become insolvent but do not go bankrupt, two and six quarters after their initial insolvency. The higher lines correspond to the credit score of individuals who go bankrupt in each quarter, one and four quarters after bankruptcy. The individuals who go bankrupt experience a sharp boost in their credit score after bankruptcy, whereas the recovery in credit score is much lower for individuals who do not go bankrupt.
Our analysis suggests that the 2005 bankruptcy reform negatively affected individuals who became delinquent by increasing the probability that they would become insolvent, a state associated with a high degree of financial distress. However, since the recovery rates for creditors from insolvent loans are higher than those from bankrupt loans, this could have induced banks and credit card companies to expand access and improve conditions on personal loans. Indeed, a recent study finds that BAPCPA reduced credit card company losses and increased their profits. However, there is little evidence that terms for consumers, including interest rates, fees, and so on, improved.
Conclusion
Taken together, these findings suggest that the 2005 bankruptcy reform was associated with a large and persistent reduction in bankruptcy filings and a rise in insolvency and foreclosures, concentrated primarily among low-income individuals in court districts with the largest increases in filing costs. This is consistent with the notion that the increase in filing costs is driving these responses. Moreover, we show that insolvent individuals who do not go bankrupt exhibit more financial stress than those who do, suggesting that these individuals would likely prefer to file for bankruptcy if they could afford it.
Disclaimer
The views expressed in this post are those of the authors and do not necessarily reflect the position of the Federal Reserve Bank of New York or the Federal Reserve System. Any errors or omissions are the responsibility of the authors.
Stefania Albanesi is an officer in the Federal Reserve Bank of New York’s Research and Statistics Group.
Jaromir Nosal is an assistant professor in the Economics Department at Columbia University.
Zachary Bleemer is a senior research analyst in the Federal Reserve Bank of New York’s Research and Statistics Group.
Matthew Ploenzke is a research associate in the Group.




 RSS Feed
 Follow Liberty Street Economics