Correction: We changed the adjective describing borrowers owing less than $5,000 from “high-balance” to “small-balance” in the first line of the seventh paragraph. We regret the error.
Student debt continues to make headlines because of its high balances and high rates of delinquency and default—troubling issues that we discussed in our previous posts this week. A less prominent, but still important, issue is the pace at which former students are—or are not—paying off their debts. This issue is important to borrowers because the longer they take to repay their debts, the more interest they accrue, the longer they have to worry about making payments, and the longer they have to deal with the consequences of unpaid debts. It’s also important to the macroeconomy because longer repayment periods mean that a large number of young adults may have their spending and housing purchase decisions constrained by student debt (and widespread delinquency) for many years, even if they eventually qualify for some debt forgiveness. For these reasons, in this third and final post of our student loan series, we use our Consumer Credit Panel (based on Equifax data) to examine how fast (or slow) student borrowers are able to pay off their loans.
With collateralized loans, such as auto loans or mortgages, default will be followed by repossession or foreclosure, after which the debt is removed from the borrower’s credit report. By contrast, a unique aspect of student loans is that they’re difficult to discharge. After a default, defined as a loan that reaches 270 days past due, the borrower remains responsible for repayment. However, borrowers with federal loans may take advantage of special programs, including deferments, forbearances, and income-based repayment plans, which allow them to delay or lower their payments. Thus, the delinquency and default rates that we discussed in our earlier post might understate the true extent of borrower problems in the student loan market if a significant number of borrowers are availing themselves of these programs to avoid defaults. For these borrowers, what we’ll observe is not delinquencies, but slow rates of repayment on student loan balances.
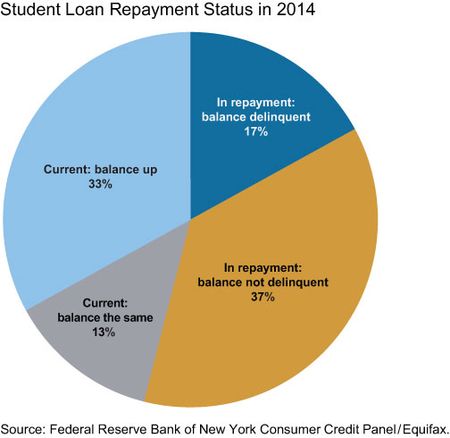
We begin our assessment of the progress on student debt repayment with a snapshot of borrowers’ repayment status at the end of 2014 (see below). Our data allow us to break down borrowers with student loans into four groups:
- Borrowers who are at least 90 days delinquent (dark blue)
- Borrowers who are current and reducing their balances (gold)
- Borrowers who are current but whose balances are either the same (grey) or higher than the previous quarter (light blue).
While 17 percent of borrowers are delinquent, only a little more than a third (37 percent) of all borrowers are making regular payments on schedule. The other nearly half of borrowers are either still in school, in deferral, or in one of the various programs that allow students to avoid delinquency. Importantly, these borrowers are not reducing their balances. As described above, the high delinquency rate and the lack of repayment can, over the longer term, be troubling for both borrowers and lenders (in this case, mostly the federal government, that is, the taxpayers).
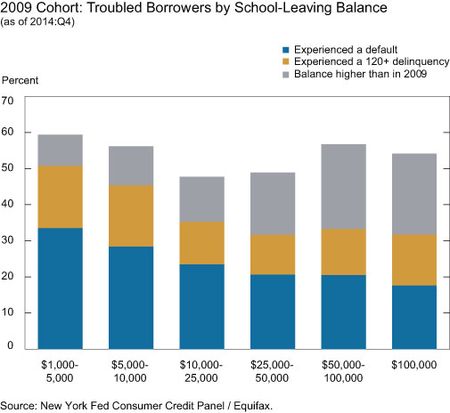
But, of course, this snapshot is static. A more dynamic and comprehensive way to look at the phenomena of delinquency, default, and slow repayment is to track the performance of a particular cohort of borrowers over time to see how their loans have performed since they stopped originating new loans. The chart below shows the incidence of these bad outcomes for the 2009 cohort, as defined in yesterday’s post, by the balances owed when the borrowers left school. Each bar in the chart shows the share of the cohort that has experienced one or more of three outcomes between their last origination (which for this cohort was in the autumn of 2008 or the spring of 2009) and the end of 2014. The blue part of each bar below reproduces the default pattern we showed in the last chart of our previous post. On top of these bars, we now include the share of borrowers in the 2009 cohort who experienced severe delinquency without default since entering repayment (in gold) and the share of borrowers who, despite never being severely delinquent on their loans, have a total balance that is higher in 2014 than in the second quarter of 2009 (in grey). For example, nearly 60 percent of the borrowers whose original balances were below $5,000 have experienced either a default (about one-third) or a 120+ days delinquency (17.2 percent), or find themselves with higher balances today than when they started (8.5 percent).
As we noted in yesterday’s post, the default rate is generally declining in origination balances at the second quarter of 2009, and that is more or less true for default plus 120+ days delinquency as well. Amounts of debt at completion may well be correlated with how much education the borrower received. Borrowers who emerge from school with lots of debt are more likely to have completed four-year or professional degrees, as opposed to those with just a little debt, who may have dropped out of school or completed less valuable training.
Note that the pattern of overall bad outcomes is U-shaped: borrowers who start out owing more than $50,000 are at risk for bad outcomes almost to the same extent as small-balance borrowers owing less than $5,000. While these high-balance borrowers haven’t defaulted or become severely delinquent in such large numbers as much as those with smaller balances, they are also not paying down their balances. Of high-balance borrowers, 22 percent have student loan balances higher in 2014 than they did in 2009, even without ever falling into severe delinquency or default. In fact, the incidence of growing balances increases with the size of the original debt. Balances are rising, as these borrowers are making payments that are lower than the interest that is accruing. This pattern can occur when borrowers are in deferred payment or forbearance periods (and thus making no payments at all) or in Income Based Repayment programs that require only small payments tied to income rather than loan amortization. The data suggest that a combination of high expected monthly payments and perhaps more information about these repayment programs leads many of the higher-balance borrowers to experience increasing balances, even several years after they stopped originating new loans. Some of these balances will likely be forgiven after twenty-or-more years of repayment, depending on which program the borrower is participating in. But, in the meantime, the participant may carry an increasing load of nondelinquent debt on his credit file, affecting his ability to secure other types of credit.
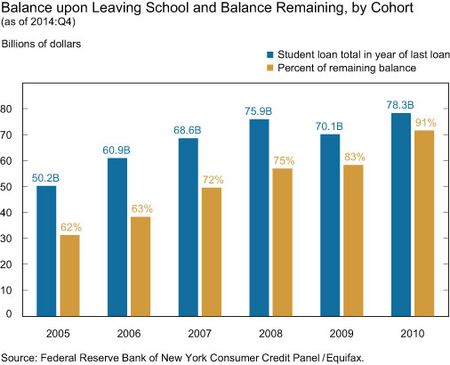
Given that more than half of borrowers have either missed payments for at least four successive months, gone into default, or entered some kind of program that causes their balances to actually increase, it’s worth looking at how much progress former students are making overall in repaying their student loan debt. The blue bars in the chart below show (for various cohorts) borrowers’ original aggregate balances upon completing origination of new loans as of the second quarter of the year indicated. The gold bars show the remaining balance as of the fourth quarter of 2014. The numbers on top of the gold bars display the share of the original balance that is still outstanding. Thus, for example, the 2010 cohort had an original outstanding balance of $78 billion, of which $71 billion, or 91 percent, remained unpaid four-and-a-half years later, at year-end 2014.
By and large, student loan borrowers in these cohorts have not made much progress in reducing their balances. Nine-and-a-half years after leaving school, the 2005 cohort has paid down only 38 percent of its original student debt. Under a standard ten-year amortization schedule, these loans would be approaching full repayment, and only about 10 percent of the original balance would remain.
Some have argued that rising student debt and slow repayment are not particularly worrisome. After all, the story goes that if households can afford the modest payments they are making, then why worry about the cost of debt? But, of course, widespread failure to repay is a problem for the lender, in this case, federal taxpayers. We don’t fully understand yet how the burden of large amounts of debt on households’ balance sheets for long periods of time affects student borrowers’ behavior, but our research so far suggests that growing student debt has contributed
to the recent decline in the homeownership rate and to the sharp increase in parental co-residence among millennials.
We started our series with a brief discussion of the value of a college degree, and that’s an appropriate place for us to conclude. Nothing in our analysis undermines the strong case for completing a college degree. Rather, our evidence suggests that the way we as a society finance those degrees—with an increasing reliance on debt held by the students—has costs to both borrowers and lenders that are now becoming more apparent. We’ll continue to search for new facts to bring to the table and advance the debate.
Disclaimer
The views expressed in this post are those of the authors and do not necessarily reflect the position of the Federal Reserve Bank of New York or the Federal Reserve System. Any errors or omissions are the responsibility of the authors.

Meta Brown is a senior economist in the Federal Reserve Bank of New York’s Research and Statistics Group.

Andrew F. Haughwout is a senior vice president in the Bank’s Research and Statistics Group.

Donghoon Lee is a research officer in the Bank’s Research and Statistics Group.

Joelle Scally is the administrator of the Center for Microeconomic Data in the Bank’s Research and Statistics Group.

Wilbert van der Klaauw is a senior vice president in the Bank’s Research and Statistics Group.


 RSS Feed
 Follow Liberty Street Economics
Liberty Street, you link to a New America Foundation article that claims there’s a “tax bomb” 20 years hence from loan balances that will be forgiven. Question for you: how could there possibly be a ‘tax bomb’ in the future for 1.3 trillion that was already collected in taxes? Didn’t we already pay that? I think we did… Congress wants to spend some revenue from student loan repayments that isn’t materializing, because of involuntary insolvency, lack of jobs, lack of wages that support regular repayment. Too bad. Student debtors want our right to bankruptcy back. Fictional corporate “persons” have the right to bankruptcy, even when they borrow from the federal government.
A high proportion (one-half to two-thirds) of the balances in those 2005-2008 vintages would be consolidation accounts where the standard repayment plan is not 10 year but is actually in the 20 year to 30 year range, based on the amount of debt when consolidating. This is more like a mortgage. You can also look at rated FFELP securitizations from that era for the break-out.
To Cesar: Thanks for your comment. In the standard repayment plan, student loans are amortized over only 10 years, so as we describe above, we would expect the 2005 cohort to have paid down a significant portion of their balance as they near the end of the 10 year term. We account for the capitalization by using the total balance reported in June of school leaving year. To Anonymous: We agree with the general motivation of income based programs as you mentioned; however, the percentage of borrowers who were not able to make progress on reducing the balance from many years ago looks much higher than one would have expected.
The real opportunity here is to offer borrowers who have been in repayment longer than originally intended the option to repay just the principal or some reasonable calculation of principal plus interest. The borrower gets to pay off at less than current exhorbitant amount and the bank wins by getting payment and not default.
Have you checked the actual pay down of a 30yr mortgage during the first 10 years even when not missing any payments? It is minimal, at least at interest rates similar to student loans. Payments primarily cover interest during those early yrs. Now toss into the mix the large capitalization that follows an initial, post-origination 4yr in-school period. It could be 20 yrs before you see a balance below the amout you originally borrowed. Yet no one seems to be complaining that mortgage debt is hindering consumer capital markets for cars or credit cards – or hindering investment in college education. And banks are making money on all the interest. In this case it is the taxpayers who are cleaning up.
Would it be possible to update some of the charts in the old student loan presentation from two years ago? http://www.newyorkfed.org/newsevents/mediaadvisory/2013/Lee022813.pdf In particular, delinquency rates by age, cohort and repayment status, as well as transition rates. It would be helpful to have ongoing monitoring of key statistics.