Young Americans’ living arrangements have changed strikingly over the past fifteen years, with recent cohorts entering the housing market at much lower rates and lingering much longer in their parents’ households. The New York Times Magazine reported this past summer on the surge in college-educated young people who “boomerang” back to living with their parents after graduation. Joining that trend are the many other members of this cohort who have never left home, whether or not they attend college. Why might young people increasingly reside with their parents? They may be unable to find employment, they may be saving their income to pay down increasing levels of student debt, or they may be unable to afford the rent for an apartment in the face of lower income or higher housing prices.
In a new Federal Reserve Bank of New York staff report, we discuss our analysis of these trends using the New York Fed Consumer Credit Panel (CCP). The CCP is a unique data set that includes information on the ages and locations of a large, representative sample of U.S. individuals and households. This data set’s size allows us to analyze residence patterns for very narrow age groups, here twenty-five- and
thirty-year-olds, at very fine geographic levels. Such fine age and geographic detail helps us distinguish among the various local economic forces that may be driving young people home.
Because of data limitations, we define an individual to be “living with her parents” if she is living with any individual who is at least fifteen years older, which could include parents as well as aunts or uncles, grandparents, or (rarely) other considerably older household members. (Rich detail on our parental co-residence measure is available in the staff report.) The analysis that follows relies on this co-residence standard to study residence trends among twenty-five- and thirty-year-olds in a representative sample of adult Americans.
The animated image below shows rates of parental co-residence across the forty-eight contiguous states at different points in time. In 2003, between 20 and 30 percent of twenty-five-year-olds lived with their parents (using our measure) in twenty-five of the forty-eight states. By 2013, all forty-eight states had parental co-residence rates of more than 30 percent. Indeed, for twelve states, the parental co-residence rate for twenty-five-year-olds had risen above 50 percent. Four states—Maine, Minnesota, New Hampshire, and Vermont—saw the rate at which twenty-five-year-olds live with their parents increase by more than twenty percentage points between 2003 and 2013. Parental co-residence was highest in Mid-Atlantic and Southern states in 2003, but by 2013 it was highest in the Northeast and Midwest.
The map shows the increasing rate of parental co-residence among 25-year-olds from
2002-03 to 2012-13.
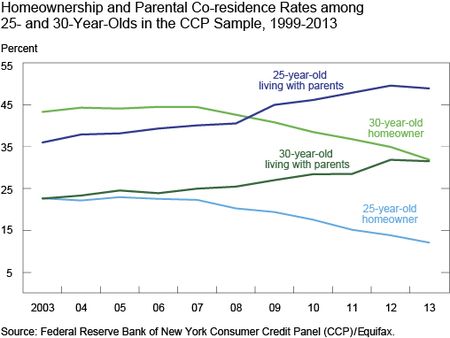
The chart below tracks the national trend in parental co-residence for twenty-five- and thirty-year-olds. Parental co-residence increased steadily for both age groups from at least 2003 through 2012, followed by a leveling off or slight decline in 2013. The chart also shows one measurement of household formation—homeownership—which has been decreasing for both twenty-five- and thirty-year-olds since 2007, the end of the housing bubble and the start of the Great Recession. While
thirty-year-olds were twice as likely to own a home as they were to live with their parents in 2003, we find that they were equally likely to own a home or live with their parents in 2013.
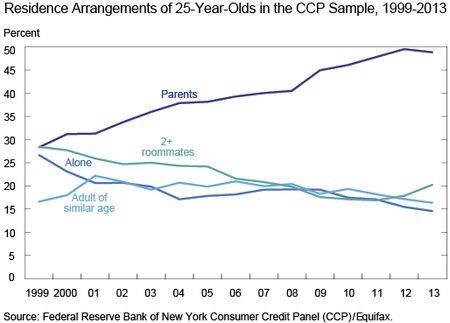
Our next chart presents an exhaustive set of four possible residence states for twenty-five-year-olds: they could live with parents, or alone, or with one roommate of similar age, or with more than one roommate. (Our analysis excludes children in the household.) The chart shows that parental co-residence has risen at the expense of living alone and living with multiple roommates. The chart also suggests, however, that the trend in parental co-residence has not substantially changed the fraction of individuals living with a single roommate, an arrangement that in many cases is likely to be a romantic partnership. (These patterns are similar for thirty-year-olds, where our analysis using the Current Population Survey indicates that co-residence with one adult is a highly accurate indicator of romantic partnership.)
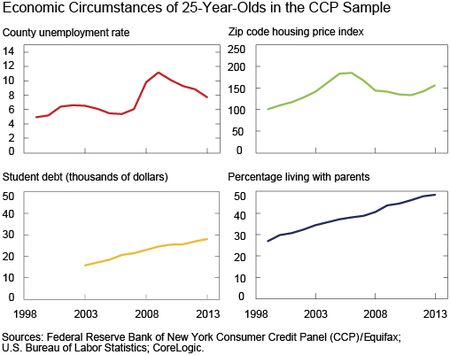
Given these broad trends, one might ask what forces are driving Millennials home. The chart below depicts trends in the local economic environment faced by twenty-five-year-olds in our sample from 2003 to 2013, along with the trend in their rate of living with parents. The chart raises two key questions: First, if staying longer with parents is a symptom of economic difficulty, and economic growth is its cure, then why do we see a persistent, almost linear climb in the rate of co-residence with parents, rather than, for example, peaks and troughs that track unemployment over the business cycle? Second, does the similarity in the aggregate trends in student debt and parental co-residence truly mean that graduates (and dropouts) are staying or returning home in order to tackle growing debt burdens?
Estimates in our staff report attempt to address these questions. Our results demonstrate that local economic growth is a mixed blessing when it comes to building youth independence: Improvement in youth employment conditions enables young people to move away from their parents, but rising local house prices are estimated to have forced many young people to move back home. These two effects partially offset each other.
However, the relationship we observe between rising student debt and co-residence with parents is clearer. The chart below presents a state-level scatter plot of the change in the rate of living with parents from 2008 to 2013 against the change in average student debt per graduate. It reveals a clear positive correlation between a state’s student debt growth and the rate at which its twenty-five-year-olds live with their parents. The regression line in the chart indicates that a $10,000 increase in student debt per graduate in the state is associated with an additional 2.9 percentage point rise in the rate of living with parents. (Estimates in the staff report that account for changes in the local economy and other factors tell a similar story.)
Our findings, then, confirm the view, widely reported in the American media, that today’s young people are more likely to live in parental households long into their twenties than were young people one or two decades ago. This trend is widespread across the United States. Finally, while local economic growth, reflected in rising youth employment and escalating house prices, has mixed consequences for youth independence, the increasing magnitude of student debt among college graduates appears to be driving young people home and keeping them there. We will examine this relationship—between education, finance, and socioeconomic outcomes in the short and long term—further in our future research.
Disclaimer
The views expressed in this post are those of the authors and do not necessarily reflect the position of the Federal Reserve Bank of New York or the Federal Reserve System. Any errors or omissions are the responsibility of the authors.

Zachary Bleemer is a senior research analyst in the Federal Reserve Bank of New York’s Research and Statistics Group.
Meta Brown is a senior economist in the Bank’s Research and Statistics Group.
Donghoon Lee is a research officer in the Bank’s Research and Statistics Group.
Wilbert van der Klaauw is a senior vice president in the Bank’s Research and Statistics Group.


 RSS Feed
 Follow Liberty Street Economics