In this second post in our series on measuring labor market slack, we analyze the labor market outcomes of long-term unemployed workers to assess their employability and labor force attachment. If long-term unemployed workers are essentially nonparticipants, their job-finding prospects and attachment to the labor force should resemble those of nonparticipants who are not looking for a job and should differ considerably from those of short-term unemployed workers. Using data that allow us to follow workers over longer time periods, we find that differences in labor market outcomes between short- and long-term unemployed workers exist, but these differences narrow at longer horizons. In contrast, labor market outcomes for the long-term unemployed are substantially different from those of nonparticipants who do not want a job.
We use longitudinally linked micro data on workers from the Current Population Survey (CPS) to compute transition rates for four different labor market statuses into employment and nonparticipation. The CPS, produced by the Census Bureau and the Bureau of Labor Statistics, is the U.S. government’s monthly survey used to estimate unemployment and labor force participation. Respondents participate for two four-month periods exactly one year apart. The probability that a short-term unemployed worker finds a job and is employed one month later can be computed simply as the fraction of the short-term unemployed in a given month who, in the next month’s survey, report that they are employed. Using this method, one can compute monthly and annual flow transition probabilities for the short- and long-term unemployed as well as for those in two categories of nonparticipation: those who report they want a job and those who report they do not want a job (whom we refer to as “other nonparticipants”) for each month.
Job-Finding Prospects of the Long-Term Unemployed
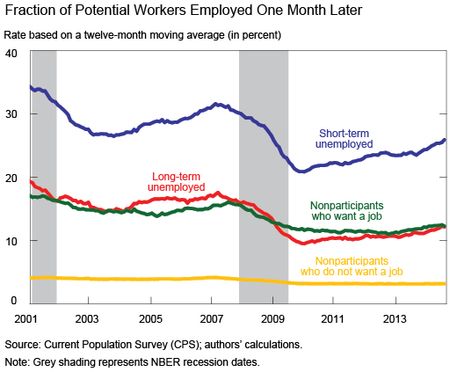
The first margin that might make the long-term unemployed less relevant for wage pressures is their job-finding prospects relative to the short-term unemployed. The chart below shows that the short-term unemployed have the highest transition rate into employment; around 26 percent of short-term unemployed workers in August 2014 report finding a job in September 2014. The long-term unemployed have lower job-finding rates, with only 12 percent finding a job from August 2014 to September 2014. The transition rate into employment is similar for the long-term unemployed and nonparticipants who want a job but it is considerably lower for other nonparticipants. Interestingly, while the transition rate into employment responds to labor market conditions for the first three groups—declining notably during the recession and rebounding slowly in the recovery—it is essentially unresponsive to labor market conditions for other nonparticipants. In terms of employment outcomes, the long-term unemployed seem to be somewhere between the short-term unemployed and other nonparticipants and very similar to nonparticipants who want a job.
Despite their sluggish recovery in the aftermath of the Great Recession, monthly transition rates into employment are still quite high for both the short-term and the long-term unemployed. For example, a 12 percent job-finding rate for the long-term unemployed would suggest that around 80 percent of the long-term unemployed find employment within a year. However, annual transition rates (from being unemployed to having a job one year later) in the CPS are considerably lower than those implied by the monthly transition rates, as documented in Krueger, Cramer, and Cho (2014). Part of this difference might be the result of not having any information about the labor market experiences of CPS respondents during the eight months between the two sets of interviews. They could have found jobs and lost them, possibly even more than once.
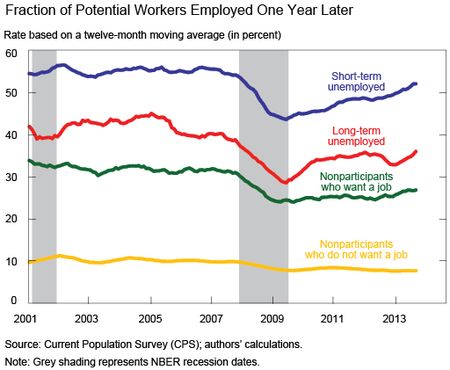
Keeping this caveat in mind, the chart below shows the fraction of each group who report being employed one year later. The series ends in September 2013 since we can only measure one-year-ahead outcomes through September 2014. Measured over a one-year horizon, long-term unemployed workers are still less likely to be employed than the short-term unemployed but, importantly, the differences in annual transition rates are smaller than the differences in monthly transition rates. For example, 36 percent of the long-term unemployed in the October 2012 to September 2013 period reported being employed one year later, compared with 52 percent of the short-term unemployed. We also find that these rates were higher for both groups before the Great Recession, with the rate at around 40 percent for the long-term unemployed and around 55 percent for the short-term unemployed.
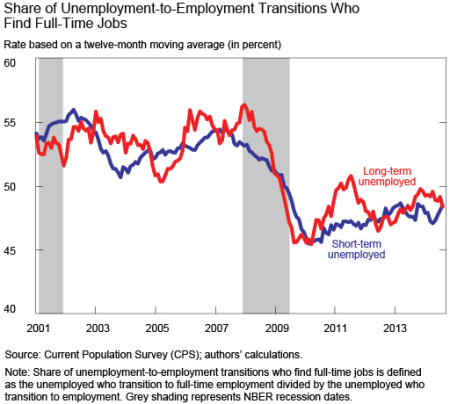
Krueger, Cramer, and Cho argue that these findings imply that the long-term unemployed are not successful in finding stable employment. We offer a different interpretation. Our study of transition rates for the short-term unemployed before and after the recession shows that, even for these workers, annual transition rates have been around 50 percent. This suggests that the discrepancy between monthly and long-term transition rates is not specific to the long-term unemployed and is more likely to be the consequence of the type of jobs that unemployed workers (short- or long-term) typically find: short-term jobs and/or part-time jobs, and jobs with high turnover. The chart below shows that conditional on finding a job, both the short-term and long-term unemployed had slightly below a 50 percent chance of finding full-time jobs in the past few years, much lower than the rate for workers in full-time jobs in the U.S. economy (around 81 percent). See comments by Abraham (2014) and Shimer (2014) (pages 281 and 287 of the PDF, respectively) for a more detailed discussion of the differences between monthly and annual transition rates.
We now turn to the annual employment transition rates for nonparticipants. Interestingly, despite the similar monthly transition rates of the long-term unemployed and nonparticipants who want a job, the annual transition rates of the long-term unemployed are noticeably higher for the entire 2001-to-2013 period. For other nonparticipants, both the monthly and annual transition rates are much lower than for any other group. Extending the horizon to one year reveals the stark differences in labor market outcomes of the long-term unemployed relative to both groups of nonparticipants.
Labor Force Attachment of the Long-Term Unemployed
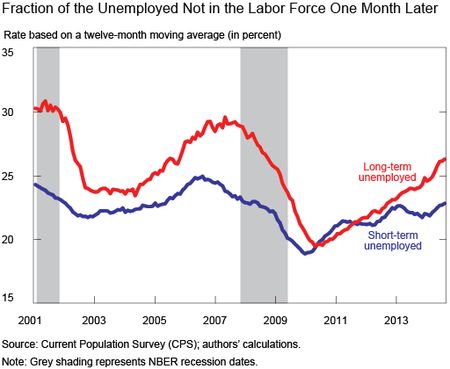
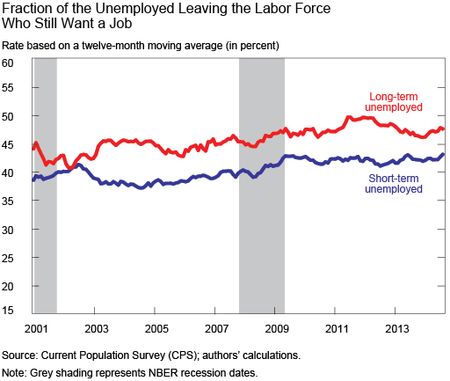
The other margin that might make the long-term unemployed less relevant for wage pressures is their labor force attachment. The charts below show that long-term unemployed workers have a somewhat higher transition rate into nonparticipation than short-term unemployed workers, but the difference is small. In addition, the charts show that after the long-term unemployed and short-term unemployed have flowed into nonparticipation, members of both groups are equally likely to report that they want a job.
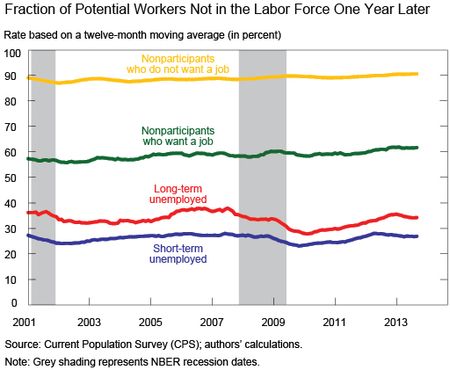
Finally, we consider long-term labor force attachment by computing, by labor force status, the fraction of respondents not in the labor force one year later. Only 27 percent of the short-term unemployed in 2013 dropped out of the labor force one year later, and only 34 percent of the long-term unemployed dropped out. By comparison, the rates were 62 percent for nonparticipants and 91 percent for other nonparticipants.
In conclusion, we have documented monthly and annual transition rates into employment and nonparticipation for short- and long-term unemployed workers and two different categories of nonparticipants. While there are differences between the monthly employment transition probabilities of short- and long-term unemployed workers, their longer-term labor market outcomes are more similar. In addition, transition probabilities for the long-term unemployed are substantially different from those for nonparticipants who do not want a job. This argues against the hypothesis that the long-term unemployed are essentially nonparticipants and are not relevant for assessing slack in the labor market.
Disclaimer
The views expressed in this post are those of the authors and do not necessarily reflect the position of the Federal Reserve Bank of New York or the Federal Reserve System. Any errors or omissions are the responsibility of the authors.
Robert C. Dent is a research analyst in the Federal Reserve Bank of New York’s Research and Statistics Group.
Samuel Kapon is a senior research analyst in the Bank’s Research and Statistics Group.
Fatih Karahan is an economist in the Bank’s Research and Statistics Group.
Benjamin Pugsley is an economist in the Bank’s Research and Statistics Group.
Ayşegül Sahin is an assistant vice president in the Bank’s Research and Statistics Group.




 RSS Feed
 Follow Liberty Street Economics
Very interesting post. I particularly thought chart 3 (Rate at which long and short term unemployed find full time jobs) was interesting. The overall rate at which unemployed persons find jobs (U->E transition rate) has increased quite meaningfully recently but chart 3 does not show this same trend. Does this suggest that the recent increase in the overall probability of re-employment (U->E rate) has been driven by an increase in the unemployed taking part time jobs? Thanks.