Since the financial crisis of 2007-08 and the Great Recession, many commentators have been baffled by the “missing deflation” in the face of a large and persistent amount of slack in the economy. Some prominent academics have argued that existing models cannot properly account for the evolution of inflation during and following the crisis. For example, in his American Economic Association presidential address, Robert E. Hall called for a fundamental reconsideration of Phillips curve models and their modern incarnation—so-called dynamic stochastic general equilibrium (DSGE) models—in which inflation depends on a measure of slack in economic activity. The argument is that such theories should have predicted more and more disinflation as long as the unemployment rate remained above a natural rate of, say, 6 percent. Since inflation declined somewhat in 2009, and then remained positive, Hall concludes that such theories based on a concept of slack must be wrong.
In an NBER working paper and a New York Fed staff report (forthcoming in the American Economic Journal: Macroeconomics), we use a standard New Keynesian DSGE model with financial frictions to explain the behavior of output and inflation since the crisis. This model was estimated using data up to 2008. We find that following the increase in financial stress in 2008, the model successfully predicts not only the sharp contraction in economic activity, but also only a modest decline in inflation.
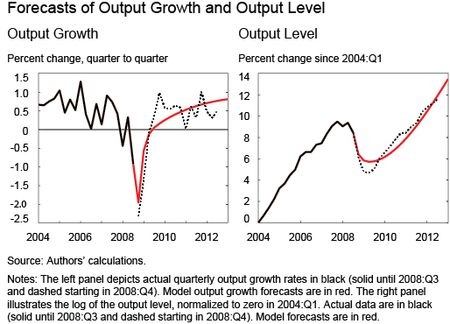
The left panel of the next chart shows the output growth forecasts made with information right after the collapse of Lehman Brothers, which sparked the recent financial crisis. The black solid lines show the available data at that time, the red solid line is the model’s forecast, and the black dashed lines correspond to realized data. When made aware of the financial consequences of the Lehman default with corporate bond spread data, the DSGE model predicts a sharp drop in GDP and a very sluggish recovery. Indeed, the model’s forecast for output in 2012:Q3 (right panel) is remarkably close to the actual value. Quite strikingly, based on the information available post Lehman, the DSGE model predicts output to be well below the pre-2008 trend four years after the financial crisis.
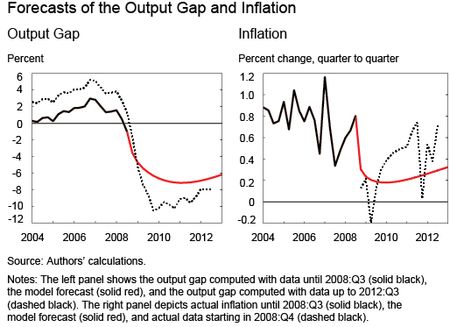
In the next chart at left, we depict the DSGE model-implied output gap. Loosely speaking, this is the difference between output and potential output, defined as the counterfactual level of output in an economy without nominal rigidities and financial frictions. The illustration makes the point that the low level of output after 2008:Q4 is not an efficient outcome for the economy, according to the model (or, in other words, is not due to a fall in potential output). In 2008:Q4, the model forecasts large and persistent gaps (up to -7 percent), which are only slightly smaller by the end of the sample (about -6 percent). The estimated output gap is somewhat larger in absolute terms than the forecasted one, nearing -10 percent by the end of 2009, and it recovers only gradually.
The right panel shows the inflation forecasts, with inflation measured by the GDP deflator. The DSGE model misses the brief deflation in 2009:Q1, which was due to falling energy prices, and the rise in inflation in 2010 and the beginning of 2011 coinciding with the surge in commodity prices. But aside from these transitory movements, the model produces reasonable inflation forecasts. To sum up, using information available at the end of 2008, the DSGE model predicts a drop in output growth of roughly the same magnitude as the actual one as well as the subsequent sluggish recovery with a large and persistent output gap. However, unlike Hall’s conjecture, the model does not predict deflation.
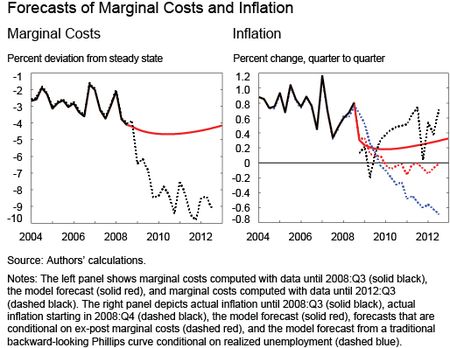
Why does the model not forecast persistent deflation? We will return to this question in more detail in Wednesday’s post. For now, we note that in this New Keynesian model inflation is determined by firms’ expectations of future marginal costs. (Marginal costs—the costs of producing additional units of output—are not directly observed, but are inferred by the model.) We therefore inspect the marginal cost forecasts shown in the solid red line in the left panel of the next chart. The picture makes clear that even when firms saw their actual costs fall in the midst of the downturn, they were expecting their marginal costs to return eventually to normal levels.
One might think that there would have been more disinflation if firms had known ahead of time how low their marginal cost would turn out to be (shown by the dashed line). To dispel that idea, we reproduce in the right panel the model’s baseline forecast of inflation (solid red line) from the previous chart and depict an alternative inflation forecast (dashed red line) that is obtained assuming that the actual path of marginal costs is known at the time of the forecasts. The resulting forecast for inflation is, of course, lower than the baseline forecast, but not dramatically so.
The forward-looking nature of the model’s Phillips curve is crucial to understanding the lack of disinflation in the face of substantial economic slack. Indeed, a backward-looking Phillips curve, according to which inflation depends on the realized unemployment rate and past inflation rates (dashed blue line), forecasts a deflation of about 2 percent annualized. To rationalize the positive inflation we have seen in recent years, proponents of backward-looking Phillips curves have resorted to other measures that show the economy faced relatively little slack, despite the magnitude of the Great Recession. (This is in part why there has been so much focus recently on short-term unemployment, which has returned to pre-recession levels, rather than total unemployment as a measure of slack. See, for example, Krueger, Cramer, and Cho 2014).
In modern New Keynesian DSGE models, however, the present value of expected future marginal costs is the more meaningful way of measuring slack. This implies that inflation may remain stable in the face of a large drop in current marginal costs, provided that marginal costs are expected to rise sufficiently in the future. In our model, monetary policy accommodation is the key reason why marginal costs are projected to rebound, as we will explain in more detail in our next post.
Disclaimer
The views expressed in this post are those of the authors and do not necessarily reflect the position of the Federal Reserve Bank of New York or the Federal Reserve System. Any errors or omissions are the responsibility of the authors.
Marco Del Negro is an assistant vice president in the Federal Reserve Bank of New York’s Research and Statistics Group.
Marc Giannoni is an assistant vice president in the Research and Statistics Group.
At the time this post was written, Raiden Hasegawa was a senior research analyst in the Research and Statistics Group.
Frank Schorfheide is a professor of economics at University of Pennsylvania.


 RSS Feed
 Follow Liberty Street Economics
Houses can be bought for 10 to 20 cents on the dollar. The deflation was mostly in Real Estate.