What Do Climate Risk Indices Measure?

As interest in understanding the economic impacts of climate change grows, the climate economics and finance literature has developed a number of indices to quantify climate risks. Various approaches have been employed, utilizing firm-level emissions data, financial market data (from equity and derivatives markets), or textual data. Focusing on the latter approach, we conduct descriptive analyses of six text-based climate risk indices from published or well-cited papers. In this blog post, we highlight the differences and commonalities across these indices.
Blog Series on the Economic and Financial Impacts of Extreme Weather Events in the Fed’s Second District

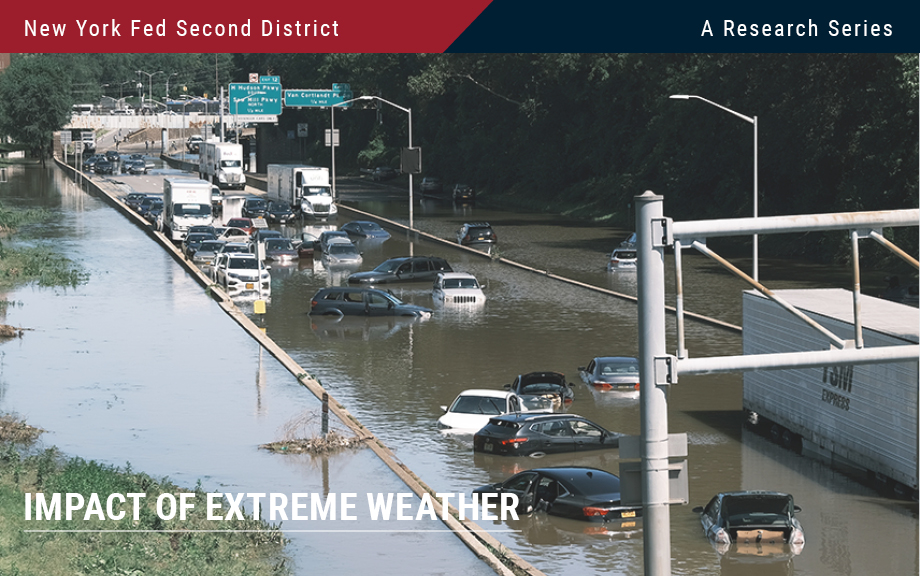
The frequency and ferocity of extreme weather events, such as flooding, storms, and deadly heat waves, have been on the rise in recent years. These climate events, along with human adaption to cope with them, may have large effects on the economy and financial markets. It is therefore paramount to provide research about the economy’s vulnerability to climate events for policymakers, households, financial institutions, and other players in the world economy to make informed decisions. In the coming days, we are going to present a series of nine posts that attempt to take a step in this direction while focusing on the Federal Reserve System’s Second District (NY, northern NJ, southwest CT, Puerto Rico, and the U.S. Virgin Islands). The twelve Federal Reserve Districts are depicted in this map.


 RSS Feed
 Follow Liberty Street Economics