Liberty Street Economics
Return to Liberty Street Economics Home Page

1 posts on "heatwave"
November 8, 2023

Blog Series on the Economic and Financial Impacts of Extreme Weather Events in the Fed’s Second District
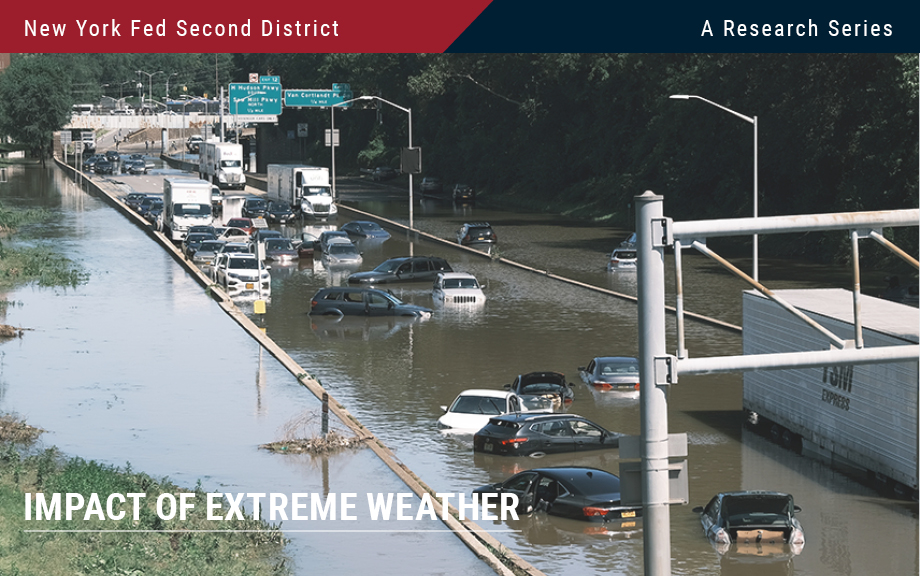
Photo: a New York highway flooded. A highway full of stalled cars with water up to their doors.

The frequency and ferocity of extreme weather events, such as flooding, storms, and deadly heat waves, have been on the rise in recent years. These climate events, along with human adaption to cope with them, may have large effects on the economy and financial markets. It is therefore paramount to provide research about the economy’s vulnerability to climate events for policymakers, households, financial institutions, and other players in the world economy to make informed decisions. In the coming days, we are going to present a series of nine posts that attempt to take a step in this direction while focusing on the Federal Reserve System’s Second District (NY, northern NJ, southwest CT, Puerto Rico, and the U.S. Virgin Islands). The twelve Federal Reserve Districts are depicted in this map.

Posted at 7:00 am in Banks, Financial Markets, New York | Permalink
About the Blog

Liberty Street Economics features insight and analysis from New York Fed economists working at the intersection of research and policy. Launched in 2011, the blog takes its name from the Bank’s headquarters at 33 Liberty Street in Manhattan’s Financial District.

The editors are Michael Fleming, Andrew Haughwout, Thomas Klitgaard, and Asani Sarkar, all economists in the Bank’s Research Group.

Liberty Street Economics does not publish new posts during the blackout periods surrounding Federal Open Market Committee meetings.

The views expressed are those of the authors, and do not necessarily reflect the position of the New York Fed or the Federal Reserve System.

Economic Research Tracker

Image of NYFED Economic Research Tracker Icon Liberty Street Economics is available on the iPhone® and iPad® and can be customized by economic research topic or economist.

Economic Inequality

image of inequality icons for the Economic Inequality: A Research Series

This ongoing Liberty Street Economics series analyzes disparities in economic and policy outcomes by race, gender, age, region, income, and other factors.

Most Read this Year

Comment Guidelines


We encourage your comments and queries on our posts and will publish them (below the post) subject to the following guidelines:

Please be brief: Comments are limited to 1,500 characters.

Please be aware: Comments submitted shortly before or during the FOMC blackout may not be published until after the blackout.

Please be relevant: Comments are moderated and will not appear until they have been reviewed to ensure that they are substantive and clearly related to the topic of the post.

Please be respectful: We reserve the right not to post any comment, and will not post comments that are abusive, harassing, obscene, or commercial in nature. No notice will be given regarding whether a submission will or will
not be posted.‎

Comments with links: Please do not include any links in your comment, even if you feel the links will contribute to the discussion. Comments with links will not be posted.

Send Us Feedback

Disclosure Policy

The LSE editors ask authors submitting a post to the blog to confirm that they have no conflicts of interest as defined by the American Economic Association in its Disclosure Policy. If an author has sources of financial support or other interests that could be perceived as influencing the research presented in the post, we disclose that fact in a statement prepared by the author and appended to the author information at the end of the post. If the author has no such interests to disclose, no statement is provided. Note, however, that we do indicate in all cases if a data vendor or other party has a right to review a post.

Archives