The Thomson Reuters/University of Michigan Survey of Consumers (the “Michigan Survey” hereafter) is the main source of information regarding consumers’ expectations of future inflation in the United States. The most recent release of the Michigan Survey on March 25 drew considerable attention because it showed a large spike in year-ahead expectations for inflation: as shown in the chart below, the median rose from 3.4 to 4.6 percent and the other quartiles of responses showed similar increases. What may have caused this rise in inflation expectations and what lessons should be taken from it? In this post, we draw upon the findings of an ongoing New York Fed research project to shed some light on the possible sources of the recent increase and to gauge its significance. While our research spans both short- and medium-term inflation expectations, this blog post discusses movements in short-term measures only and does not discuss medium-term expectations.
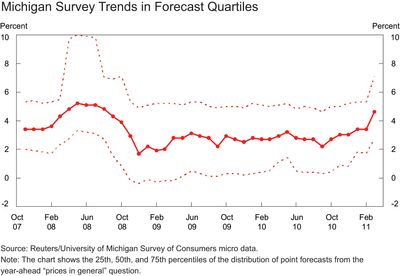
Inflation expectations are a key consideration in the conduct of modern monetary policy. Expectations are widely believed to affect people’s behavior by influencing a wide range of economic decisions such as saving, investment, purchases of durable goods, wage negotiation, and so forth. Indeed, findings from ongoing research at the New York Fed are consistent with this view and suggest that people act on their inflation expectations in their economic choices. Moreover, households interact with firms in the wage-setting process. As a consequence, inflation expectations of consumers influence real economic activity and actual inflation. Therefore, it is crucial for a central bank to monitor inflation expectations, ensuring that they remain well anchored and consistent with monetary policy objectives. To this end, central banks not only look at market-based measures of inflation expectations and surveys of professional forecasters and businesses, but also track surveys of consumers’ inflation expectations, including the widely followed Michigan Survey.
In the summer of 2006, researchers at the New York Fed, in collaboration with academic economists, psychologists, and survey design specialists, launched the Household Inflation Expectations Project to improve the survey measurement of inflation expectations. As part of our research, we wanted to learn more about the information content of the Michigan Survey and the ways in which respondents interpret the survey’s questions. This effort led us to develop an experimental survey that contained questions from the Michigan Survey as well as new and complementary questions—including questions aimed at eliciting respondents’ medium-term expectations for inflation and their uncertainty about inflation outcomes. In addition to asking respondents about their expectations for the change in “prices in general,” which is the question used in the Michigan Survey, we also asked respondents directly about their expectations for the “rate of inflation.”
Our research shows that the “rate of inflation” question leads to more focused interpretations by survey participants: in answering the question, respondents mostly think about changes in the overall price level in the nation or about the change in the cost of living. In contrast, the wording of the Michigan question induces mixed interpretations, with many people thinking about the specific prices they pay in their everyday purchases, and especially those prices that undergo large changes, such as food and gasoline prices. As a result, the Michigan measure appears to reflect expectations of food and gasoline price increases to a much larger extent than is suggested by their share in household expenditures and in measures of overall inflation such as the consumer price index.
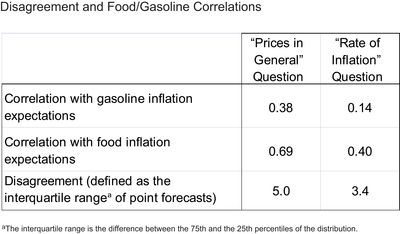
The greater sensitivity to changes in specific prices leads to larger swings in short-term inflation expectations in the Michigan Survey. This feature is evident in the next chart, which compares the time series of year-ahead expectations from our own experimental survey based on the “prices in general” and on the “rate of inflation” question. Moreover, the largest gap between median expectations in the two measures coincides with the run-up in commodity prices during the summer of 2008. This feature is consistent with the “prices in general” measure being more strongly correlated with an individual’s expectations of gasoline and food inflation, as shown in the first two rows of the table below (drawn from Table 1.14 in a 2008 working paper). Finally, a recent study conducted at Carnegie Mellon University shows that people who focus on specific prices tend to recall larger price changes and to express more extreme inflation expectations.
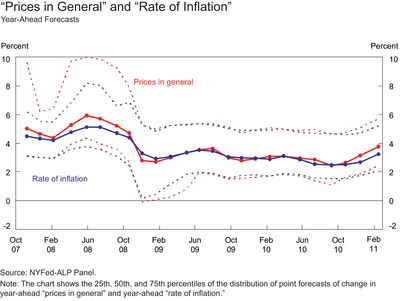
Expectations based on the “prices in general” question also exhibit greater disagreement across survey participants than those based on the “rate of inflation” question. In the chart, disagreement can be measured as the distance between the upper and lower dotted lines of the same color, which respectively represent the 75th and the 25th percentiles of the point forecasts elicited by each question. The red dotted lines tend to be further apart than the blue ones, indicating that the interpretation of the “prices in general” question is more varied than the interpretation of the “rate of inflation” question. This pattern is most evident during the previous episode of the run-up in commodity prices in the summer of 2008 and can also be seen in the last row of the table (drawn from Table 1.4 of our 2008 working paper).
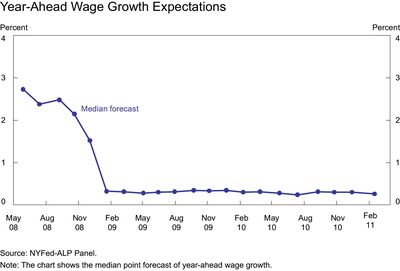
With this background information, we now return to our initial question: What factors could explain the recent large spike in short-term inflation expectations observed in the Michigan Survey? One possible explanation is that the observed rise in inflation expectations is tied to an expected increase in nominal wages. In the 1970s, the interplay between wages and inflation was much discussed as increases in inflation and wages proved mutually reinforcing, setting off a wage-inflation spiral. In our experimental survey, we also ask respondents to report their expectations about growth in wage earnings a year from now if they stay in the same job, in the same position, and work the same number of hours. As the chart below indicates, year-ahead median wage growth expectations have remained muted since February 2009. While this is a troubling sign for wage earners’ incomes, it suggests that concerns about wages exer
ting second-order effects on inflation are not founded at present.
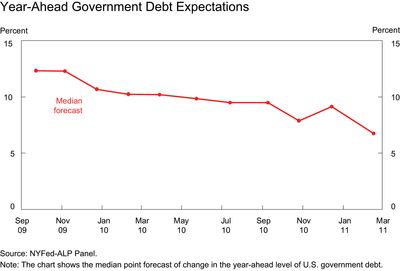
Another possible explanation for the Michigan Survey reading is that short-term inflation expectations may be responding to concerns about accelerating growth in government debt. In our survey, we also ask respondents about their expectations for the year-ahead change in the level of government debt. We find that these expectations have actually declined in recent months, as shown in the chart below. Therefore, the recent rise in inflation expectations does not seem to be tied to an expected increase in the growth of government debt.
Finally, our experimental survey also asks respondents about expected price changes for specific items. The last chart reports year-ahead inflation expectations for gasoline, food, medical costs, and housing costs. The survey responses point to increases in inflation expectations for food and housing costs, as well as an especially large increase in expectations for gasoline inflation. Together, the spike in short-term inflation expectations seen in the Michigan Survey and the surge in expected gasoline and food inflation are consistent with our finding that the wording of the Michigan Survey question is quite sensitive to price changes for specific items. As noted earlier, our research also shows that people who think about specific prices tend to recall larger price changes and express more extreme inflation expectations.
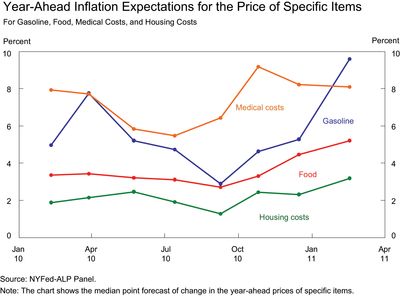
In sum, our research shows that expectations of higher nominal wage growth or concerns about increased growth of nominal government debt are unlikely to be behind the recent increase in short-term inflation expectations reported in the Michigan Survey. Instead, we suggest that this rise in inflation expectations reflects two factors: (1) sharp expected increases in food and especially gasoline prices and (2) the use of a survey question (“prices in general”) that results in reported expectations being more sensitive to these types of price change. An important open question concerns the extent to which households act on their expectations of overall inflation as well as on their expectations of specific price changes. As noted earlier, one significant area in which inflation expectations may influence consumer behavior is in the wage negotiation process, but thus far neither the “prices in general” nor the “rate of inflation” measure appears to be feeding into increases in expected future wage growth. We hope to return to this open question in a future post.
Chart data ![]() 13 kb
13 kb
Disclaimer
The views expressed in this post are those of the author(s) and do not necessarily reflect the position of the Federal Reserve Bank of New York or the Federal Reserve System. Any errors or omissions are the responsibility of the author(s).


 RSS Feed
 Follow Liberty Street Economics
People experiencing high gas prices will expect them to continue until a direction change is reported in the commodity markets. Unfortunately, policy makers have done little to address these rational expectations. It will also lead to an expectation of much higher heating oil prices this winter. Should that materialize, consumers in early primary states like New Hampshire will convey their sentiments at the ballot box.