


James Kahn* and Robert Rich
Economists generally agree that productivity is the primary ingredient for sustainable growth in GDP and wages. The August productivity data release provided some clarification regarding trend—or long-run—GDP growth, but the news was not good: Following a resurgence of strong productivity growth in the late 1990s and early 2000s after nearly a quarter-century of slow growth beginning in 1973, the latest reading from a trend tracking model now indicates that slow productivity growth returned in 2004. In this post, we describe our “regime-switching” productivity model and share the model’s insights into the historical profile of high- and low-growth regimes as well as the outlook for productivity.
Many economic and financial variables experience episodes in which their behavior seems to change quite dramatically. These episodes can result from events such as wars, changes in government policies, or structural change in the economy. Productivity is a series that has shown occasional changes in its trend growth rate. During the post-war period, productivity growth slowed around 1973. Around 1997, however, it increased to a level similar to that observed during the 1948-73 period.
Because productivity displays occasional shifts in its trend growth rate, we drew upon the work of Professor James Hamilton of the University of California at San Diego to develop a regime-switching model designed to capture these changes in the behavior of productivity. (A more general discussion of the model is available in our Current Issues article, while additional technical details are provided in our staff report.) Here, we simply highlight a few key features of the model. The regime-switching model allows productivity to shift between a low- and high-growth regime, but does not require the dates of the shifts to be specified in the estimation procedure. Instead, the dating of the regimes is based on the model assigning a probability that productivity is in a particular growth phase at each time period. It also turns out that there are two other series—real labor compensation and consumption (relative to total hours of work)—whose trend growth rates display shifts similar to that of productivity in terms of timing and magnitude (as economic theory predicts they should). As a result, we include these series as additional model inputs.
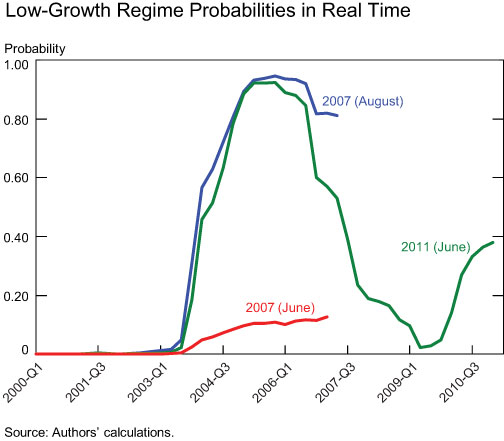
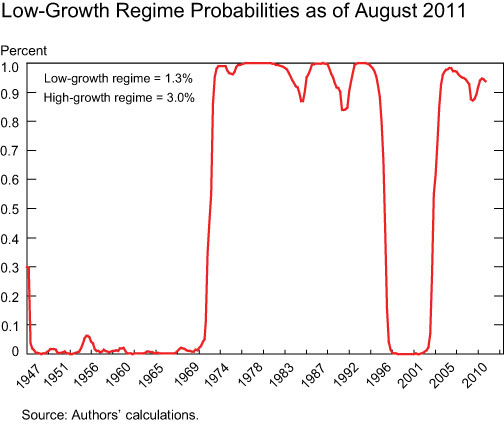
When we first estimated the model using quarterly data starting in the late 1940s, it identified a switch from the high-trend growth regime to the low-trend growth regime around 1973, as well as a switch back to the high-trend growth regime around 1997. More recently, the model indicated as of mid-2007 (following a midyear data revision similar to the one that just took place) that a slowdown had begun in 2004. This is shown in the chart below, which depicts, as of the data release dates indicated, the model’s historical profile of the probability that the economy is in a low-trend growth regime. Between June 2007 and August 2007, the model suddenly began to attach a high probability to the low-growth regime going back to 2004. While the delay in recognizing the return of the low-growth regime was partly due to the need to accumulate statistical evidence of the shift, it was primarily triggered by data revisions that lowered growth over the previous three years, similar to the recent release. But after a strong recovery of productivity growth in 2009, when nonfarm output per hour was thought to have grown by more than 6 percent, the model began to waver between the high-trend growth regime of roughly 3.0 percent annually and the low-trend growth regime of less than 1.5 percent. This is shown by the probability pattern evident in June 2011.

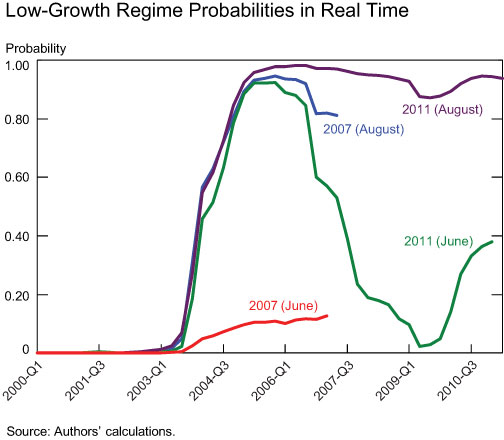
Unfortunately, not only are the productivity numbers in the August 2011 data release very weak, with two consecutive quarters of negative growth, but revisions going back three years lowered productivity growth over that period by more than half a percentage point. This, plus similar downward revisions in the model’s other indicators, resulted in a dramatic negative reassessment of trend growth, as indicated in the chart below. The probability that we are currently in the low-growth regime increased from around 0.4 to 0.9, and it now appears very likely that we have been in this low-growth regime since 2004. This reaffirms the model’s assessment during the August 2007-December 2008 period.

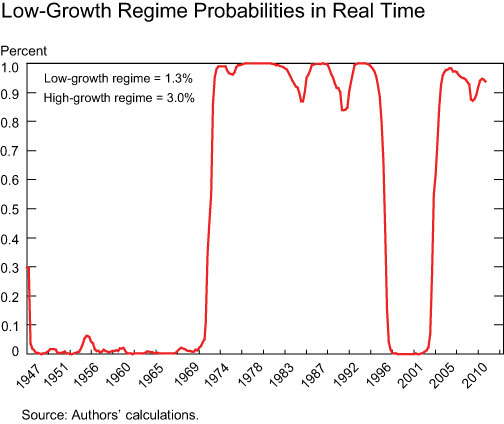
With the revised data, we see that productivity growth since 2004 has been a mere 1.65 percent annualized, well below the 3.2 percent during the prior eight years. Moreover, the model’s other two key inputs—growth in real labor compensation and growth in consumption relative to hours of work—have also slowed considerably. This means that potential GDP growth is in the vicinity of 2.5 percent, and has been there for the last eight years. Providing a longer historical context, the next chart shows that the model associates the post-2004 behavior of productivity with the same low-growth regime that persisted from 1973 to 1997.
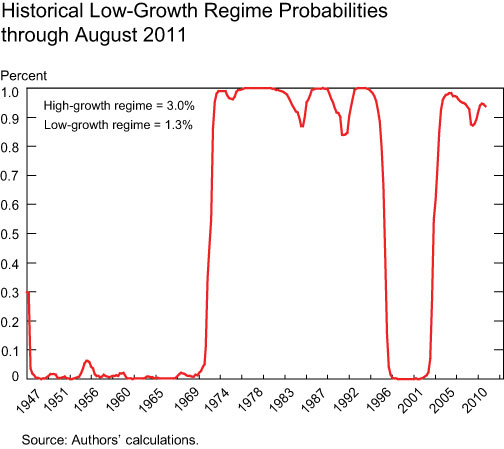
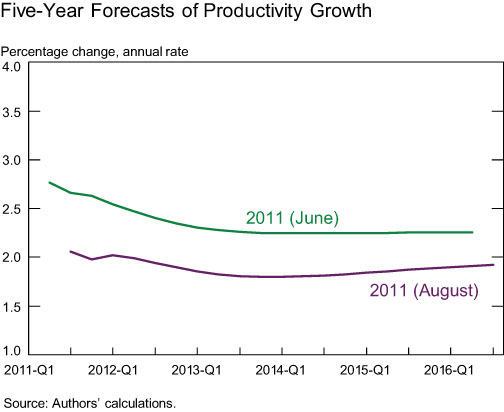
It remains to be seen whether this is just a “correction,” and that growth will revive in coming years, or whether slow growth is the “new normal,” but the model forecasts productivity growth to be below 2 percent over the next five years.

Model updates take place with each productivity data release and are available at the model’s web page. As shown, the subsequent data release in September confirmed the findings of the August release.
*James Kahn is the Kressel Professor of Economics at Yeshiva University.
Disclaimer
The views expressed in this blog are those of the author(s) and do not necessarily reflect the position of the Federal Reserve Bank of New York, or the Federal Reserve System. Any errors or omissions are the responsibility of the author(s).
 RSS Feed
 Follow Liberty Street Economics