


Meta Brown, Andrew F. Haughwout, Donghoon Lee, Maricar Mabutas,*
and Wilbert van der Klaauw
Student loans support the education of millions of students nationwide, yet much is unknown about the student loan market. Relevant data are limited and, for the most part, anecdotal. Also, sources tend to focus on recent college graduates and do not reveal much information about the indebtedness of parents, graduate students, and those who drop out of school.
To inform the public and policymakers, we devote this post to some new findings obtained from the FRBNY Consumer Credit Panel, a unique and nationally representative data set sourced from Equifax credit reports. The FRBNY Consumer Credit Panel has made possible our Quarterly Report on Household Debt and Credit, first issued in the second quarter of 2010. We will examine the overall student loan debt market as of third-quarter 2011, giving particular attention to changes from the second to the third quarter and highlighting new findings by age group as well.
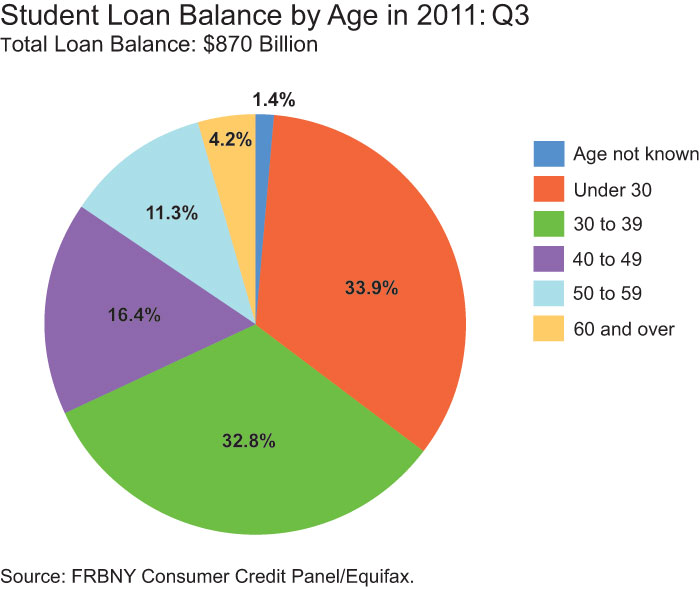
The outstanding student loan balance now stands at about $870 billion,1 surpassing the total credit card balance ($693 billion) and the total auto loan balance ($730 billion). With college enrollments increasing and the costs of attendance rising, this balance is expected to continue its upward trend. Further, unlike other types of household debt such as credit cards and auto loans, the student loan market is incredibly complex. Numerous players and institutions hold stakes at each level of the market, including federal and state governments, colleges and universities, financial institutions, students and their families, and numerous servicers and guarantee facilitators.
Student loans have received considerable media attention in recent months as researchers and policymakers voice growing concern about the heavy debt loads assumed by students and their parents. In addition to worries about the volume of outstanding student debt, there is concern about having enough federal aid to support the large number of students taking up postsecondary education. Federal and state governments are deeply involved in the student loan market, either directly originating student loans or indirectly guaranteeing them. The Health Care and Education Reconciliation Act, signed into law last year, ended private lending of federally subsidized loans, approved expansion of Pell Grants, and appropriated funds to invest in institutions that serve minority and low-income populations. Still, advocates for students clamor for more to be done to increase the availability of student loans. Further, state budget cutbacks to higher education amid tight fiscal circumstances may result in higher tuition.
In October 2011, President Obama announced executive actions to cap monthly federal student loan repayment at 10 percent of discretionary income for college graduates, eased from the previous 15 percent. This cap comes as some relief to those who worry about how they will pay back their debt. Moreover, student loan debts are typically shouldered by recent college graduates and other young workers, who tend to face lower incomes and higher rates of unemployment than older cohorts.
From the second to the third quarter of 2011, the total outstanding student loan balance grew 2.1 percent, from $852 billion to $870 billion. Over the same time period, other types of consumer debt declined or remained flat. Of the 241 million people in the United States who have a credit report with Equifax, our data provider, about 15.4 percent—or 37 million—hold outstanding student loan debt. The student loan debt, however, is not evenly distributed across the general population. Among people under thirty years old, 40.1 percent have outstanding student loan debt. Among people between the ages of thirty and thirty-nine, 25.1 percent have outstanding student loan debt. In contrast, only 7.4 percent of people who are at least forty years old have outstanding student loan debt. As a result, $580 billion of the total $870 billion in student loan debt is owed by people younger than forty (see charts below).


The average outstanding student loan balance per borrower is $23,300. Again, there is substantial heterogeneity in balances of individual borrowers. The median balance of $12,800 is roughly half the average level, which indicates that a small fraction of people have balances significantly higher than the median. About one-quarter of borrowers owe more than $28,000; about 10 percent of borrowers owe more than $54,000. The proportion of borrowers who owe more than $100,000 is 3.1 percent, and 0.45 percent of borrowers, or 167,000 people, owe more than $200,000. The distribution also varies by age group: for example, borrowers between the ages of thirty and thirty-nine have the highest average outstanding student loan balance, at $28,500, followed by borrowers between the ages of forty and forty-nine, whose average outstanding balance is $26,000 (see chart below).

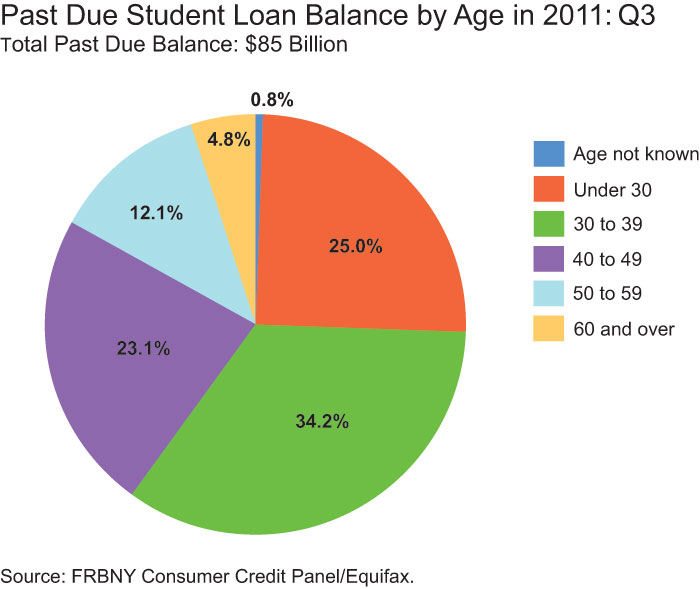
How much difficulty are borrowers having paying back their debts? Of the 37 million borrowers who have outstanding student loan balances as of third-quarter 2011, 14.4 percent, or about 5.4 million borrowers, have at least one past due student loan account. Together, these past due balances sum to $85 billion, or roughly 10 percent of the total outstanding student loan balance. To put this in perspective, the same 10 percent rate applies on average to other types of household delinquent debt, including mortgages,
credit cards, and auto loans. Does this mean that the prospects for student loan delinquencies are similar to those for the household debt in general, and thus no special attention is warranted? (See chart below.)

Unfortunately, this is not the case—some special accounting used for student loans, not applicable to other types of consumer debt, makes it likely that the delinquency rates for student loans are understated. In the case of federally backed loans, which represent a majority of total lending, repayment is deferred until the student graduates from school and can then be pushed back by another six-month grace period. How do these student loans in deferment or grace periods show up on credit reports and contribute to the delinquency statistics? Given that no payment is necessary until graduation, these deferred student loans are not included in the past due balance but they are included in the total balance from which the delinquency rate is derived. This may help explain the low proportion (12.6 percent) of borrowers with past due student loans among those under thirty years old, compared with 16.9 percent among those between the ages of thirty and thirty-nine, since many of the younger borrowers are still in school and don’t yet have to make any payments.
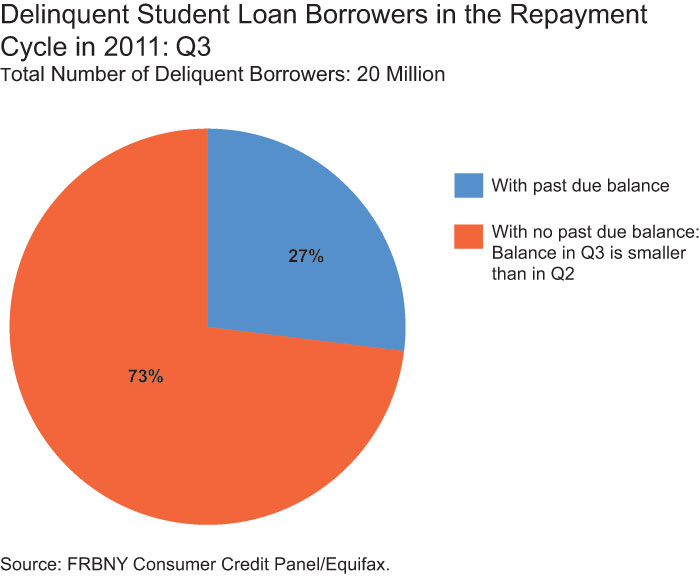
To address this potential bias in calculating delinquency statistics, we exclude individuals who appear to be temporarily exempt from making payments because they are in school or newly graduated from school. These are students who, as of third-quarter 2011, owed as much as or more than they did in the previous quarter while maintaining a zero past due balance. We will be able to make our inference more precise when loan-level panel data are available, but this is our first-cut analysis given the available data. We warn that there is room for misclassification in this analysis. For example, there could be borrowers who are subject to the income-based repayment plan whose payment fell short of the accrued interest, resulting in a balance that increased. Recall that this exercise looks at the student loan borrowers who have a balance as of third-quarter 2011; therefore, those who had taken out a loan at one point but paid it off before third-quarter 2011 are not accounted for.
From this exercise, we find that as many as 47 percent of student loan borrowers appear to be in deferral or forbearance periods, and thus did not have to make payments as of third-quarter 2011. Specifically, 17.6 percent of borrowers had exactly the same balance in the third quarter as in the second quarter of this year, and 29.1 percent increased their overall student loan balance by taking on new originations or accruing interest to the balance.
We then recalculate the proportion of borrowers with a past due balance excluding this group of borrowers. We find that 27 percent of the borrowers have past due balances, while the adjusted proportion of outstanding student loan balances that is delinquent is 21 percent—much higher than the unadjusted rates of 14.4 percent and 10 percent, respectively (see charts below).


In sum, student loan debt is not just a concern for the young. Parents and the federal government shoulder a substantial part of the postsecondary education bill. Moreover, the student loan delinquency picture is not fully captured in the broad statistics since a significant proportion of borrowers and balances are not yet in the repayment cycle. The implications of this last fact for future changes in the student loan delinquency rate are a very important area of research.
Given that student loans are an indispensable tool for educational advancement, this form of debt will remain a critical policy focus for generations to come. Going forward, we will continue to monitor the student loan market with new data each quarter, and we will try to provide useful information on the landscape of student debt.
1The marginal difference between this figure and the student loan balance found in the Quarterly Report on Household Debt and Credit can be attributed to the difference in the size of the sample used to calculate the two unique figures.
*Maricar Mabutas is an assistant economist in the Research and Statistics Group.
Disclaimer
The views expressed in this post are those of the authors and do not necessarily reflect the position of the Federal Reserve Bank of New York or the Federal Reserve System. Any errors or omissions are the responsibility of the authors.
 RSS Feed
 Follow Liberty Street Economics
Thanks again to our readers for the thoughtful comments. We are gratified by the response to our post, and agree with Steve Rhode that educational debt is not just a concern for the young. To be clear, we don’t take a strong view on whether student loans are a good or a bad thing, but with an aggregate outstanding balance of around $870 billion, educational debt is undeniably important. We hope that our new data set will continue to shed some light on this important part of consumers’ balance sheets, especially since it is difficult to get comprehensive data from other public sources, as Roberto Allende and Craig commented. We also received a few technical questions/comments, from Niezenger and Mossup. They ask if we can get a breakout of Income Based Repayment. We don’t have a direct measure of those, but if the payments are insufficient to cover all the interest due, then the balance will be increasing and we would count those as loans that are not in repayment. Mossup makes some other definitional comments as well. We count loans as delinquent only after they are at least thirty days past due. We exclude defaulted loans that have been charged off of the credit report. We exclude borrowers whom we estimate are in the deferment or grace periods from both the numerator and the denominator of our alternative delinquency calculation.
If you desire to examine evidence on default rates by sector of higher education (public, private not-for-profit and private for-profit), see: http://www.decisionsonevidence.com/2011/08/federal-financial-aid-default-rates/
It is a really very important tool for all students. I hope it help us. thanks!
They forget to mention with people in their 30’s and 40’s if they are holding high student loan debt levels they aren’t able to “feed the machine” buying stock, purchasing things to boost the economy etc. It is a huge draw down of the economy and those same people won’t be able to save for their future either and will drag it down as well towards the end of their lives if things don’t change.
The significant burden of debt that has been created by student loans, and more specifically the inflexibility of private student loan lenders is a crisis in the making. I’ve been covering this growing tragedy for some time now. The worst cases I’ve seen are those where a loving grandparent co-signed for a government backed student loan and wound up having their minimal social security benefits garnished. If it is appropriate to include this link I started a recent petition to Pass the Fairness for Struggling Students Act of 2011. See https://www.change.org/petitions/the-us-senate-pass-the-fairness-for-struggling-students-act-of-2011
If graduates are unable to repay their loans because their employment is artificially shortened by current employer hiring practices that make a mockery of the Age Discrimination Act of 1967, as Amended, criticism of that employer conduct should be allowed on this public website. Furthermore, links to two articles on the student debt crisis are also relevant. Instead, my post, which is available on Facebook, has been deleted.
It is my understanding that only half of the colleges answered the survey concerning the average student loan debt. It seems logical to assume that many universities – particularly private universities – did not report their student loan debt because they wanted to conceal how much debt their students hold. And some of those colleges that did report may have fudged the numbers because they were under no obligation to be precise. The $25,000 figure cited by colleges and news media is not an absolutely trustworthy number. I would not be surprised if the average student loan debt for a public education is closer to $35,000 and that the average student loan debt for a private education is at least $55,000. The Project on Student Debt noted that because the data is voluntarily reported by colleges, actual debt is probably higher than its report shows. ~ CNN Money. Average student loan debt tops $25,000 By Blake Ellis November 3, 2011: 5:22 AM ET
Can you break out interest rates? How much in delinquent loans will double and when?
One reason why U.S. college degrees have become an investment with a negative return is that a significant number of colleges and universities have a new business model. Behind the scenes, they now market U.S. degrees to foreigners as a means to immigrate to the US. While the topic is arcane, there are no current annual caps on F-1 (student) or J-1 (exchange visitor) visas. The student, particularly in technology fields, may obtain a OPT, giving them a 29 month period of employment where the employer sets the wages and working conditions with no annual numerical caps. This leads to the H-1B Visa (and several other work visa programs) which have high annual numerical caps and lax protections for U.S. workers. The US citizen might train their imported replacement before their job is cut. These changes amount to a behind-the-scenes foreign-hiring preference system. To learn about the political corruption that served as a foundation for this dangerous situation, please review my 2005 investigative article “Career Destruction Sites – What American colleges have become” http://tinyurl.com/nn28sp and my 2007 investigative article “The Greedy Gates Immigration Gambit” http://tinyurl.com/37l8ry. See these 2 related stories on the student debt problem. http://tinyurl.com/Trillion-Dollar-Student-Debt by Dennis Cauchon, USA Today 25 Oct 2011 and http://tinyurl.com/Seeking-Alpha-Studnt-Loan-Debt by Nicholas Pardini 05 July 2011.
Here are the top 100 holders of federal guaranteed student loans as of Sept. 30. Banks generally mix student loans in with their consumer loans in their 10K filings, except for the largest two or three. In addition, many of them are state agencies and nonprofit authorities, whose quarterly and annual financials are governed by state regulations. Finally, many are nonbank lenders or privately-held firms, which may have no requirement to file public financials at all. http://www.fp.ed.gov/attachments/publications/2010Top100CurrentHoldersPublicReport.pdf There is unfortunately no way to get a fix on who are the top holders of private education loans. Due to the large number of students needing federal student loans each year, it is not practical to do full-scaled underwriting (“credit check”). Who would do the underwriting (credit check)? Would it be the colleges analyzing someone’s creditworthiness? They are not likely to turn someone down, due to their interest in the student receiving the loan funds. Would it be a federal contractor? How would the contractor get paid? It wouldn’t do the work for free. Consider the average amount of closing costs on an American mortgage — a lot of it is to pay for the cost of the underwriting. Formal underwriting is based on more than a FICO score. Private educational loans have credit checks, and the cost of the underwriting is generally built into origination fees or the interest rate.
The median amount outstanding of $12,800 is less than the cost of a new subcompact car. The big difference is that the proved differences in lifetime earnings from greater education far outweigh the loan amount. It’s a strange society when researchers at the Federal Reserve Bank of New York seem to be concerned that people are going into debt to learn and advance our society. The unemployment rate of college graduates is around 5%. It would be far better for the same researchers to focus their energy on why our elementary, middle and high schools are not preparing more people for college and advanced technical schools.
I find good news and bad news from this report. The good news is this: about 70 percent of student loan borrowers owe $25,000 or less. Thus, for the vast majorit of borrowers, their indebtedness level is similar to the amount people borrow to buy cars. The bad news is this: 70 percent of people with past due loans are thirty years of age or older. Thus, a lot of people are well into midlife and are apparently unable to service their student loan obligations.
Thanks to our readers for the comments. Cameron Payne asks if we have data on the universities associated with these loans. Unfortunately, our data don’t give us that information. CollegeRC nicely points out the trade-off between the costs and benefits of making educational credit widely available. One important dimension here is that educational loans are the first experience with debt for many young borrowers, and they thus have thin credit records prior to getting those loans. The FOMC blackout period begins today, and we’ll be back online March 19.
You need to provide more specific definitions to explain your analysis and results. From the broad strokes, it appears you are counting many non-delinquent borrowers as delinq., and you are trying to make the denominator as small as possible. Borrowers who are 1-30 days past due. are Current, not delinq. Accounts where the default claim has been paid by the guarantor are defaulted, not delinq. They should neither be in the numerator nor the denom of a delinq. rate. While very few borrowers choose income-based repay, those loans are money-makers for the govt whether or not their balance happened to decline that year. Furthermore, counting them as delinq. when they are choosing a plan which is legit under the law seems incorrect. Borrowers who have filed for bankruptcy are not delinq.; in fact the lender can’t bill them even if it wanted to, until the court process is resolved. Borrowers during the in-school and grace period statuses are not delinq. This is not a period of laziness or sloth. These are arguably your lowest-risk borrowers, your (near) future profit centers. They should not be in the denom., but they definitely should not be in the numer. either. It is debatable whether deferments and forbearances should be in the denom., but they definitely should not be in the numer. However, think about it, if you take def/forbs out of the denom., then what is left there? Just delinq. and current repayment? Minus the repayment plans you don’t like?
Is there anyway to get a breakout of enrollment in Income Based Repayment? The borrowers enrolled in this program will not show up as being in default, but if you’re not even paying the interest on a loan what else can it be?
Does anyone know where I can go to find information on the institutions that hold student loan debt? Based on the 10K filings of the major banks it does not appear that they break out student loans in there loan portfolio.
“Federal and state governments are deeply involved in the student loan market, either directly originating student loans or indirectly guaranteeing them.” Part of the reason why student loans appear to be so complicated is the nature of Federal loans being guaranteed to every applicant regardless of credit. Of the roughly $1 trillion in outstanding student loans, the overwhelming majority is Federally originated or was backed by the FFELP program before it was eliminated. Most of these loans are Stafford loans. (Parent and Grad plus have a nominal credit review with relaxed approval standards compared to credit based loans) Because all Stafford loans were approved without a credit check, the Gov’t is now on the hook for Billions if borrowers do not repay, so the bankruptcy laws that are seemingly unfair to borrowers will not change in the near term. Best way to deal with this would be to stop guaranteeing loans without a credit check. This would be a positive turn in financial responsibility for our Gov’t, but many citizens would be unhappy to lose access to guaranteed Gov’t loans for college access. It seems impossible to have it both ways while making everyone happy.
I was disappointed to see there is no breakout of for-profit colleges and universities such as Phoenix. Is this information available elsewhere?