


Basit Zafar, Grant Graziani, and Wilbert van der Klaauw
Over the past several months, there was a flurry of debate in Washington over the extension of the payroll tax cut. Many supporters of the tax cut—worth about $1,000 to a family earning the median income of slightly more than $50,000 a year—have cited its importance to the nation’s economic recovery, while opponents claim that it will only add to the national deficit without boosting the economy. Exactly how such a tax cut affects the aggregate economy relies heavily on how U.S. workers use the extra funds in their paychecks. Unfortunately, we know little about how such tax cuts are used by workers. So we decided to ask them and, in this post, report the answers they gave us.
The initial payroll tax cut, passed into law as part of the 2010 Tax Relief Act, reduced workers’ Social Security tax withholding rate from 6.2 percent to 4.2 percent for all of 2011. After much legislative debate, the 2 percent payroll tax cut for nearly 160 million U.S. workers was extended in December 2011 for the first two months of 2012, and then again on February 22, 2012, for the rest of the year. In order to understand how these cuts might affect economic activity, we used the RAND Corporation’s American Life Panel (ALP) to conduct online surveys of 372 individuals, 200 of whom were working, at two points last year: in February 2011, and then in mid-December 2011, close to the expiration of the initial tax cuts.
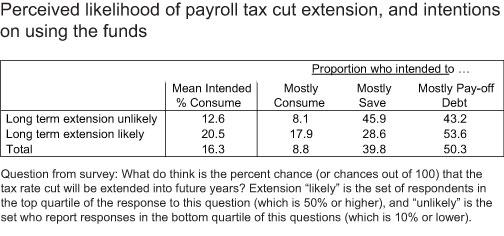
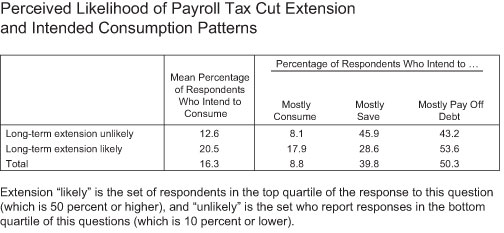
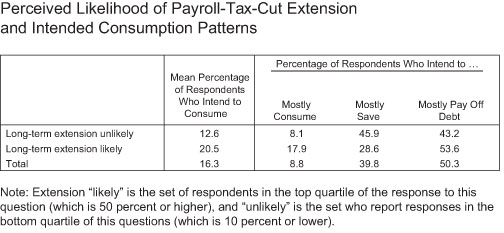
In the first survey, we asked respondents how they intended to spend any extra funds from the payroll tax cut in their paychecks. More precisely, respondents were asked to provide the share (out of 100 percent) of funds that they would spend on: consuming, saving, and paying off debt. The table below shows that 8.8 percent of respondents planned to use most of the tax-cut funds for consumption, 39.8 percent planned to use majority of it on saving, and 50.3 percent planned to use a majority of it to pay off debt. Such a low intended rate of consumption is consistent with the permanent income hypothesis, which claims that transitory changes in income should not change consumption behavior, as individuals would use the extra funds to smooth their consumption over the rest of their lifetime.

To explore the relationship between the perceived permanence of the tax cuts and the intention to spend the funds, we also asked respondents how likely they thought it was that the tax-cut extensions would continue into future years. The table below shows how intended consumption patterns relate to the perceived likelihood of future tax-cut extensions. On average, those who consider long-term extensions to be likely plan to spend about 8 percentage points more of their tax-cut funds than those who consider them to be unlikely (20.5 percent compared with 12.6 percent). Additionally, the last three columns of the table show that when comparing the two groups, a higher proportion of the “likely” group intend to use the majority of their tax-cut funds for consumption (17.9 percent compared with 8.1 percent). This supports the permanent income hypothesis, as those who consider these tax cuts to be more permanent plan to spend more of the extra funds.

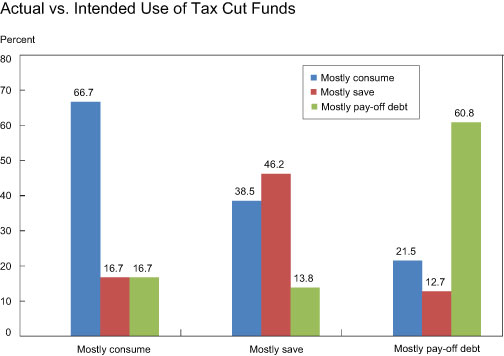
In the second survey, conducted in December 2011, respondents were asked how they had used the extra funds from the tax cut over the past year. The second column in the first table shows that 35.0 percent of individuals actually spent the majority of their tax-cut funds, a sharp increase from the intended use of 8.8 percent. We next compare individuals’ intended use of the tax-cut funds (reported in the early 2011 survey) with what they reported actually doing with the funds. The figure below shows the relative frequency of actual tax-cut-fund use by the three groups based on intended use (that is, mostly consume, mostly save, and mostly pay off debt). For example, of those who planned to spend most of their tax-cut funds, 66.7 percent did in fact spend the majority of it, while 16.7 percent saved the majority of it, and 16.7 percent paid off debt. A similarly high proportion of those who intended to use the majority of their funds to pay off debts did so (60.8 percent), while 46.2 percent of those who planned to save most of their funds actually did so. Two patterns are of note in the chart: (i) while there is a positive correlation between intended and actual uses, there is a high degree of inconsistency; and (ii) there is a systematic shift toward spending for those who did not use their funds in the way they intended, that is, individuals ended up spending more of their tax-cut funds than they had intended.

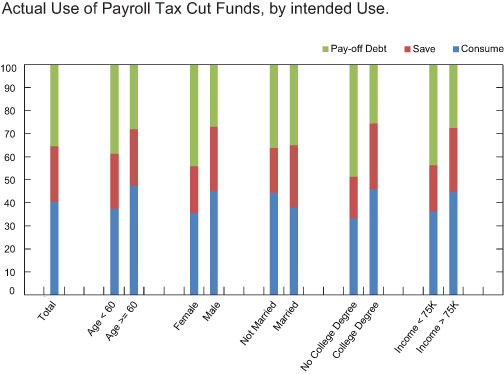
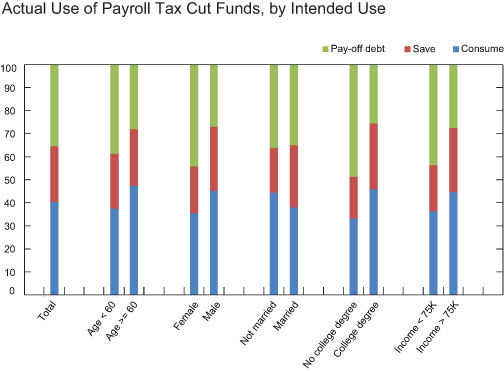
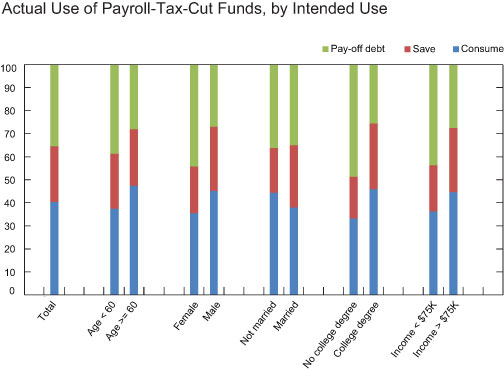
We can also go beyond grouping respondents by how they used the majority of their funds. In particular, we can directly estimate the marginal propensity to consume (MPC) by taking the average of the proportion of each person’s tax-cut funds that was reported to be used on spending. This, of course, can also be done for saving and paying off debt. This value is far more useful for policymakers when considering how the total tax cut will be used by households. The chart below summarizes the average breakdown of tax-cut-fund use for the full sample and by demographic groups. On average, respondents used 40.5 percent of their tax-cut funds on spending (that is, an MPC of 0.405), 24.1 percent on saving, and 35.3 percent on paying off debt. These figures are quite different from the intended average proportions reported in the first survey, in which, on average, respondents intended to use 16.3 percent of their tax-cut funds on spending (intended MPC of 0.163), 34.2 percent on saving, and 49.5 percent on paying off debt. That is, on average, individuals ended up spending a significantly larger part of the tax-cut funds than they had intended.

The figure also shows that the MPC varies quite a bit across demographic groups. Most notably, those with annual incomes of more than $75,000 tend to spend a slightly larger fraction than lower-income respondents (MPC of 0.44 compared with 0.37; difference not statistically significant), while those with lower incomes tend to save less and to pay off debt more than higher-income respondents (differences significant). This may seem contrary to the popular notion that tax cuts benefit those with lower incomes—who tend to be more liquidity constrained—by providing them with much needed spending money; earlier studies have in fact found that lower-income households spent a higher fraction of their 2001 and 2008 tax rebates. However, data collected from other surveys we conducted indicate that lower-income households, relative to higher-income households, experienced more credit tightening (they had significantly more involuntary credit card closures over the 2008-10 period), had greater nonmortgage debt during 2010 (median nonmortgage debt-to-income ratio of 16.7 percent compared with 8.2 percent), and perceived greater employment uncertainty during 2010. These results suggest that lower-income households are closer to the margin of being delinquent and further credit-constrained, and hence it should not be surprising that—despite being more liquidity constrained—they are no more likely to spend their tax-cut funds than higher-income households. The higher debt and tighter credit availability for the lower-income respondents also explain why they use more of their funds to pay off debt than the higher-income group (42.8 percent compared with 27.9 percent).
As shown in the chart above, it is also notable that men tend to consume more than women, and that women use far more of their tax-cut funds to pay off debt than men do. Similarly, college graduates spend more and pay off debt less than non-college graduates.
Our estimated MPC of 0.405 is at the higher end of the range of estimates from the literature based on recent tax rebates: in examining the use of the 2008 tax rebates, one study estimates an MPC of 0.33, and another an MPC of about 12 to 30 percent in the first three months from receiving the rebate; similarly, the MPC in the first three months after the 2001 tax rebates has been estimated in the 20 to 40 percent range. One possible explanation for why we observe a higher MPC out of tax-cut funds than out of tax rebates is that tax cuts show up in smaller amounts spread over multiple paychecks, which many people claim not to notice. These smaller, multiple payments may be more easily spent than large, lump-sum tax rebates.
Three of our findings are noteworthy. One, our larger MPC estimates highlight the importance of the design of tax holidays (rebates or cuts) in determining the response of spending to policies. Second, our finding—that people who perceive tax cuts to be more permanent plan to spend more of their funds—has fiscal policy implications as to whether such tax cuts are implemented as long-term extensions or sequential short-term extensions. Third, we find that people spend a large portion of their tax-cut funds to pay off debts—this may be good news considering the large debt issues leadi
ng up to and during the financial crisis—and may also suggest that our estimated MPC is an underestimate because by facilitating deleveraging, it can indirectly lead to higher future spending through a reduction in future interest payments.
Disclaimer
The views expressed in this post are those of the authors and do not necessarily reflect the position of the Federal Reserve Bank of New York or the Federal Reserve System. Any errors or omissions are the responsibility of the authors.

Basit Zafar is an economist in the Microeconomic Studies Function of the New York Fed’s Research and Statistics Group.

Grant Graziani is a research associate in the Regional Analysis Function of the New York Fed’s Research and Statistics Group.

Wilbert van der Klaauw is a vice president in the Microeconomic Studies Function of the New York Fed’s Research and Statistics Group.
 RSS Feed
 Follow Liberty Street Economics