


Adam Biesenbach* and Marco Cipriani
On May 6, 2010, several U.S.-based equity products underwent an extraordinary price decline and recovery, all within less than half an hour. The Dow Jones Industrial Average (DJIA) and other equity indices dropped by more than 5 percent in a matter of minutes, only to rebound as quickly. Individual equity securities experienced similar, if not larger, swings in prices, both up and down. This post describes what happened on that fateful day, and summarizes the findings of the academic literature on this topic.

What Caused the “Flash Crash”?
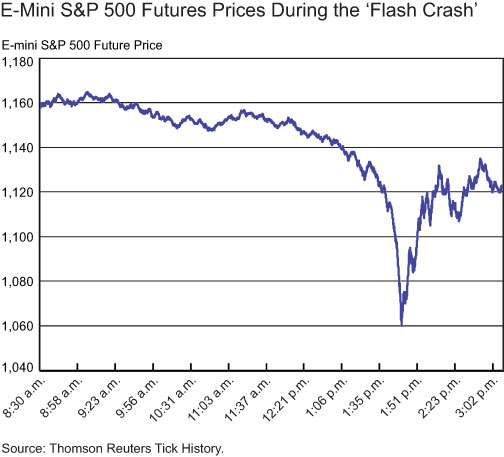
May 6 opened as a volatile day of trading in U.S. markets. In the hours before the crash, bad news about the European debt crisis increased price volatility and led to a broad decline in equity prices. As noted in the U.S. Commodity Futures Trading Commission (CFTC) and U.S. Securities and Exchange Committee’s (SEC) joint report on the crash, against the backdrop of increased uncertainty and negative market sentiment, at 2:32 p.m. EST an unusually large automated sell order was initiated in the S&P 500 E-mini market, a futures contract traded on the Chicago Mercantile Exchange. Normally, such a large order would not be executed all at once, but rather would be spread out, possibly over several hours. However, on May 6, the sell order was executed with unusual rapidity through an automatic algorithm that took into account only trading volume, disregarding prices.
The selling pressure was initially absorbed by intermediaries in the E-mini market, and in particular by High Frequency Traders (HFTs). HFTs are market participants that use high-speed, sophisticated computer algorithms to submit large numbers of trades on a daily basis. In general, HFTs do not hold their positions long enough to take directional bets. Instead, they participate on both sides of the market, maximizing turnover of their inventories in order to profit from the bid-ask spread. That is, they provide liquidity to the market, similar to traditional market makers.
After temporarily building a long position in the E-mini market, HFTs themselves began aggressively selling E-mini contracts in order to reduce their exposure. As a result of the combined selling pressure from the selling algorithm and HFTs, the price of the E-mini contract began to rapidly decline. As other traders withdrew from the market, HFTs began rapidly buying and selling contracts from one another in an effort to control their inventory levels, generating a sharp increase in volume. The selling algorithm responded to this spike in volume by increasing the rate at which it fed new orders to the market, thus exacerbating the precipitous decline in prices.
At approximately 2:45 p.m., trading in the E-mini contract was paused for five seconds by the Chicago Mercantile Exchange because of the extraordinary decrease in its price. During the pause, selling pressure in the E-mini contract was relieved, and buy orders started arriving in the market. Just after trading resumed, prices in the E-mini market stabilized.
At around the same time, because of the uncertainty surrounding the price collapse in the E-mini market, liquidity providers (traditional market makers and HFTs) withdrew from several individual equity markets and equity Exchange Traded Funds (ETFs) in order to assess the risk of continuing trading activity and the reliability of their data. This reaction caused liquidity to drop suddenly and prices to swing dramatically. In many markets, liquidity evaporated to the point that trades were executed at prices as low as a penny and as high as $100,000 (at the so-called “stub quotes,” quotes posted by market makers far away from current prices to fulfill their obligation to always quote a bid and ask price). As liquidity providers validated the integrity of their data and trading systems, they reentered the market. By approximately 3:00 p.m., securities that were severely disrupted during the crash converged back to their pre-crash levels.
Trying to Make Sense of the Crash
The “flash crash” has been the subject of several studies that try to understand both the cause of the sudden collapse in prices on May 6, and how similar events can be predicted (and avoided) in the future.
Using transaction level data in the E-mini market during May 2-6, 2010, Kirilenko et al. (2011) study the behavior of HFTs during the crash. As we mentioned, HFTs act similarly to traditional market makers and when market conditions are normal, they provide liquidity to the market. In contrast to traditional market makers, however, HFTs trade aggressively when prices are about to change in an effort to keep their inventories down. This behavior was apparent on May 6, when the speed of their trading algorithms allowed them to unwind their inventories quickly before the price decline of the E-mini contract accelerated. As a result, they aggressively drained liquidity from the market, amplifying selling pressures on the E-mini market. The authors conclude that “although HFTs did not trigger the ‘flash crash,’ their responses to the unusually large selling pressure exacerbated market volatility.” The increase in trading aggressiveness on May 6 is also documented by Chakravarty et al. (2011), who show a sharp increase in the use of Intermarket Sweeping Orders, a particular type of order that allows a trader to “sweep” liquidity across all market centers simultaneously.
According to Easley et al. (2010), liquidity providers (traditional intermediaries and HFTs) suddenly exited the market on May 6 because they believed they were trading at a loss with better informed parties. The authors call this phenomenon “order flow toxicity”: order flow (that is, the buy and sell orders arriving in the market) is considered toxic when intermediaries providing liquidity trade at a loss with market participants who are more informed. Easley and coauthors develop a measure of toxicity suited to markets in which HFTs comprise a large fraction of the trading volume, and trading horizons are extremely short. This measure, which they label the Volume-Synchronized Probability of Informed Trading (VPIN), captures the degree of order flow toxicity by estimating the volume imbalance for any given period of trading activity. Volume imbalance is a proxy for toxicity since informed traders mostly trade on one side of the market only. By their calculations, the VPIN measured on the S&P 500 E-mini was unusually high the day of the flash crash, and reached its highest level ever at 2:30 p.m., just before the crash. Because of the high toxicity of the order flow, HFTs and traditional intermediaries left the market, causing the sharp contraction in liquidity and decline in prices.
Madhavan (2011) suggests that the extreme price volatility during th
e flash crash is partially the result of market fragmentation (that is, the fact that in today’s economy trading activity is dispersed across different trading venues). Because of fragmented trading activity, market depth in each trading venue is lower, increasing market fragility. Madhavan measures fragmentation through the Herfindahl-Hirshman Index (HHI), an index often used in the industrial organization literature, computed as the sum of the square of the share of each trading venue. The index equals one if all activity is concentrated in one venue, and decreases as market fragmentation increases. Madhavan finds that securities experiencing greater market fragmentation in the month before the flash crash were disproportionately affected during the crash, and that the level of fragmentation was higher on May 6 than in the previous twenty days of trading. Moreover, the level of market fragmentation has increased dramatically over the last ten years, raising the prospect that flash crash episodes may occur again.
The studies summarized above help us understand swings in prices such as those observed two years ago. Since then, regulators have mandated changes in market operations that should make the occurrence of crashes less likely (see, for instance, the NASDAQ OMX Group, Inc.’s list of current regulatory initiatives). Particularly important is the adoption of circuit-breakers at the individual security level, the establishment of risk controls when brokers provide customers with market access, and the prohibition of markets makers’ stub quotes. The challenge facing researchers and policy makers is to understand how such changes will affect the behavior of market participants, whether they will be enough to reduce financial markets fragility, and which additional policy measures, if any, are still needed.
*Adam Biesenbach is an assistant economist in the Federal Reserve Bank of New York’s Research and Statistics Group.
Disclaimer
The views expressed in this post are those of the authors and do not necessarily reflect the position of the Federal Reserve Bank of New York or the Federal Reserve System. Any errors or omissions are the responsibility of the authors.
 RSS Feed
 Follow Liberty Street Economics