Jaison R. Abel and Richard Deitz
Over the past three decades, the United States has seen substantial growth in both high- skill and low-skill jobs, while growth of those in the middle has stagnated. At the same time, a growing gap in wages between jobs that pay the most and those that pay the least has emerged. As we discussed in a previous blog post, this combination of trends is often referred to as job polarization, and it is happening in much of the developed world. In this post, we examine the extent to which job polarization has occurred in upstate New York, downstate New York, and Northern New Jersey. We find that job polarization has been significant in all of these places, contributing to a sharper than average rise in inequality in downstate New York and Northern New Jersey.
Technology and globalization appear to be the driving forces behind job polarization, displacing many jobs involving routine tasks where computers or relatively low-cost labor from other countries can serve as a good substitute. As a result, this displacement has been most pronounced for traditional middle-skill workers. By contrast, these same forces have increased employment opportunities for high-skill workers who create and use technology, while lower-skill service jobs requiring physical proximity or face-to-face contact have largely been insulated.
To illustrate job polarization trends for the United States and region, we draw on U.S. Census data for the 1980-2010 period. We map each worker into one of twenty five consistently defined occupations, and then use median wage as a proxy for skill to group these occupations into four categories: high skill, upper-middle skill, lower-middle skill, and low skill. It turns out that the lower-middle skill category contains the occupations most likely to engage in routine tasks, and therefore those most easily displaced by technology or inexpensive labor from other countries.
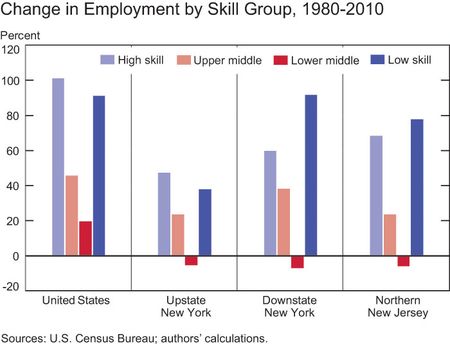
The chart above shows the change in employment between 1980 and 2010 for each skill group for the nation, upstate New York (New York State north of Dutchess and Orange counties), downstate New York (the remainder of New York State), and Northern New Jersey. While job growth in nearly every category was slower in the region than in the nation, largely reflecting slow population and employment growth across the Northeast, a clear U-shaped pattern emerges in each area, indicating the most rapid growth in jobs has been at the high-skill and low-skill segments of the labor market, with little if any growth in the middle-skill groups.
While lower-middle skill jobs grew slowly in the nation, jobs in this category declined in all three local areas. In large part, this difference reflects significant job losses in two large occupations within this group that are most likely to engage in routine tasks: machine operators and administrative support jobs. Indeed, the region’s manufacturing jobs have been especially prone to displacement. For example, machine operator jobs fell by 56 percent in upstate New York and 62 percent in downstate New York and Northern New Jersey between 1980 and 2010, well above the national decline of 35 percent. Similarly, administrative support jobs also fell rapidly in the area. In 1980, administrative support accounted for about one in four jobs in New York City, and one in five jobs in Northern New Jersey, a share that declined to under 15 percent in both places by 2010.
It is also noteworthy that jobs in the low-skill category grew the most compared to other skill groups in downstate New York and Northern New Jersey, while this trend was not the case nationally or in upstate New York. In general, this expansion of low-skill jobs reflects strong growth in many service jobs that require face-to-face contact that are not as prone to displacement by technology and globalization, such as home health care aides, food service workers, hairdressers, and child care workers. High income growth in and around New York City, especially for high-wage workers, has likely supported relatively strong growth in these types of jobs downstate and in Northern New Jersey, a trend that was not quite as significant in upstate New York where income growth was weaker than average.
Technology and globalization have also impacted the wage distribution across jobs. While cheaper labor from other countries and the diffusion of technology have put downward pressure on the wages paid to workers engaged in routine tasks, advances in technology have helped make high-skill workers more productive. Indeed, as we demonstrated in our previous blog post, the wage gap has been widening among occupations primarily because wage growth for high-skill jobs has outpaced the rest of the pack. The relatively strong growth of high- and low-skill jobs has amplified this wage inequality.
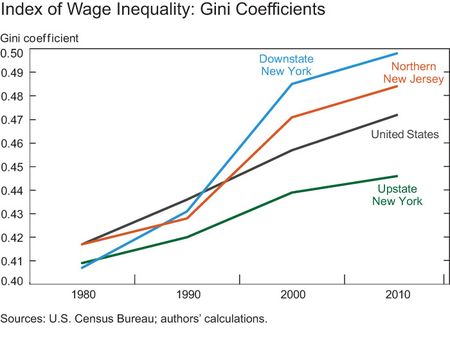
In the chart above, we plot a common measure of inequality—the Gini coefficient—for the nation, upstate New York, downstate New York, and Northern New Jersey. The chart shows that wage inequality has increased since 1980 in the nation and across the region. The rise in inequality was sharpest in downstate New York and in Northern New Jersey, where inequality is now above the level in the United States overall. The more rapid rise in inequality in and around New York City is explained by the combination of above-average wage growth for high-skill workers and more substantial growth in low-skill jobs relative to the nation as a whole. By contrast, the rise in inequality was slower than average in upstate New York.
Clearly, the loss of job opportunities for middle-skill workers has created challenges for many workers in the New York-New Jersey region. More than ever before, it is important for workers to acquire and build skills, and for employers and educational institutions to work together to help them accomplish these goals. For more information about job polarization in the region and what can be done to help workers adapt to these changes, see the New York Fed’s latest Quarterly Regional Economic Press Briefing.
Disclaimer
The views expressed in this post are those of the authors and do not necessarily reflect the position of the Federal Reserve Bank of New York or the Federal Reserve System. Any errors or omissions are the responsibility of the authors.


 RSS Feed
 Follow Liberty Street Economics
In Britain there has been a polarization of the employees. On the one hand, a few persons have up skilled, with raised levels of high-level skills being awarded, while, on the other hand, a section of the employees is being deskill either through technical deskill or through organizational deskill, resulting in an underclass which faces a degradation and loss of enrichment of work.