Andrew Haughwout, Donghoon Lee, Joelle Scally, and Wilbert van der Klaauw
Today’s release of the 2012Q2 Quarterly Report on Household Debt and Credit indicates a continuation of the downward trend in household debt, which followed a long period of substantial increases. As of June 30, 2012, total outstanding household debt was down nearly $1.3 trillion since its peak in the third quarter of 2008. In the Liberty Street Economics blog’s inaugural post, we used the FRBNY Consumer Credit Panel to decompose this change in household indebtedness. Leading up to the crisis, households increased their cash holdings available for consumption by extracting equity from their homes, using home equity lines of credit and cash-out refinances, and by increasing their nonmortgage balances, such as credit card and auto loan balances. When the Great Recession struck, consumers reversed this behavior and began reducing rather than increasing these obligations. We demonstrated that although some of the reduction in household debt was due to charge-offs (the removal of obligations from consumers’ credit reports because of defaults), much of the debt reduction seen at the overall level was attributable to deleveraging: households actively borrowing less and paying down existing liabilities. In this post and accompanying interactive charts, we update our analysis, using the newly available 2010 and 2011 FRBNY Consumer Credit Panel data to determine whether those trends have continued.
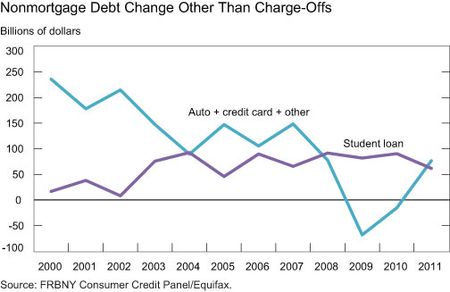
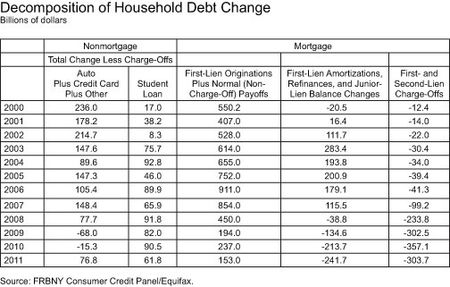
First, we’ll focus on the change in nonmortgage debt—such as credit cards, student loans, and auto loans—stripping out the effects of charge-offs. The data are slightly revised from what we originally posted in March 2011, in which the nonmortgage debt change dipped slightly into negative territory in 2009. The revision is due to the inclusion of our improved data on student loan balances, which were previously underestimated. Still, the data indicate a change in behavior. From 2000 until 2007, consumers were adding an average of $212 billion per year to their outstanding debt balances; in 2009, new consumer borrowing dropped to $14 billion. In 2010 and 2011, new consumer borrowing partially recovered; but in 2011, debt less charge-offs increased by only $138 billion, still below the 2000-07 average.
Interestingly, the chart below reveals that the trends are starkly different for various loan types; consumers actively reduced debt for consumption-related expenditures for both 2009 and 2010, but new borrowing for education was fairly constant throughout the period.
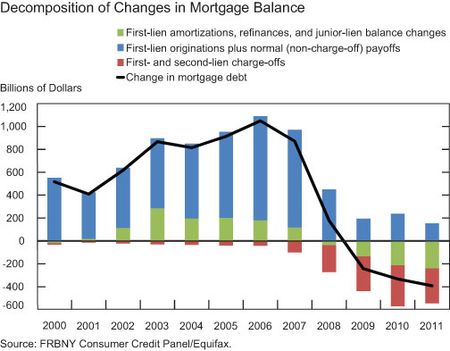
Moving to debt secured by real estate, we see that in spite of some slight revisions, the story looks more or less the same as what we saw last spring. We explained in our earlier blog post why the decomposition is more complicated for mortgage charge-offs. Consumers continued paying down their mortgage debt, even at a faster rate, during 2010 and 2011. Using the same framework we described in our earlier blog post, we break the change in debt outstanding into three components, which add up to the line in the chart below.
- First, the blue bars in the chart represent changes in balances associated with normal housing transactions. This series includes new originations due to home purchases as well as payoffs of mortgages associated with the sale of a house. With home prices depressed and sales volume at historically low levels, it’s unsurprising that the series fell sharply and remains low.
- Next, in red, we show the gross value of charge-offs due to default and foreclosure. Consumers saw $303 billion removed from their credit reports due to charge-offs in 2011, compared with $357 billion in 2010.
- Finally, in green, we highlight the combined impact on debt of cash-out refinances of first liens; changes in junior-lien balances, including home equity lines of credit; and regular amortizations of first-lien balances. Between 2001 and 2007, this series was increasing; equity extraction (through junior liens and first-mortgage refinances) outpaced the amount by which households paid down their mortgage balances through regular amortizations. Since 2008, however, households have actively paid down their mortgages, and the net amount paid off has increased each year. Consumers paid down mortgage debt by $241 billion in 2011 and $213 billion in 2010.
When we combine nonmortgage and mortgage debt, we find that the active reduction of debt continued in 2010 and 2011. We conclude that while nonmortgage debt rebounded somewhat in 2011, household deleveraging continued, primarily as homeowners continued to pay down their housing debt.
Disclaimer
The views expressed in this post are those of the authors and do not necessarily reflect the position of the Federal Reserve Bank of New York or the Federal Reserve System. Any errors or omissions are the responsibility of the authors.

Andrew Haughwout is a vice president in the Research and Statistics Group of the Federal Reserve Bank of New York.

Donghoon Lee is a senior economist in the Research and Statistics Group of the Federal Reserve Bank of New York.

Joelle Scally is an economic analyst in the Research and Statistics Group of the Federal Reserve Bank of New York.

Wilbert van der Klaauw is a vice president in the Research and Statistics Group of the Federal Reserve Bank of New York.


 RSS Feed
 Follow Liberty Street Economics
When we combine nonmortgage and mortgage debt, we find that the active reduction of debt continued in 2010 and 2011. It’s the really true!