


M. Henry Linder, Richard Peach, and Robert W. Rich
Following a significant slowing during the recent recession, growth in various
labor compensation measures has stabilized during the past two to three years. This
stabilization is puzzling because it’s widely held that a significant amount of
slack remains in the economy. Accordingly, this large amount of slack should
result in a further slowing in compensation (wage) growth. In this post, we
show that there’s a very mild trade-off between compensation growth and
resource slack, even though slack is sizable. Consequently, the observation that
there’s slow but steady growth in labor compensation measures is consistent with
a large amount of slack in the current economic environment.
Our analysis is based on the
estimation of a nonlinear wage-inflation Phillips curve that draws upon the modeling
approach outlined in a Boston Fed paper by
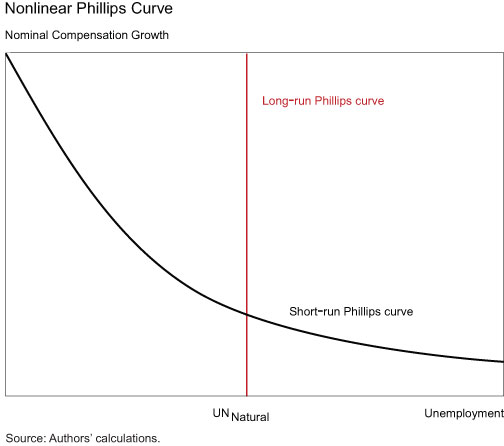
Fuhrer, Olivei, and Tootell. The key feature of the nonlinear Phillips curve is
that the impact of a change in slack depends on the level of slack. These features
are illustrated in the chart below, where the slope of the Phillips curve
becomes steeper as the unemployment rate moves further below the natural rate of
unemployment (higher resource utilization), while the slope becomes flatter as
the unemployment rate moves further above it (lower resource utilization).

Why might the Phillips curve flatten
out as the unemployment rate rises further above the natural rate of
unemployment? As a reminder, what matters for labor market decisions is the
real wage rate—the nominal wage adjusted for the price level (or cost of
living). One explanation for the flattening of the Phillips curve is downward
real wage rigidity—that is, a more sluggish response of real wages when the
unemployment rate is high (see the Boston Fed paper by
Holden and Wulfsberg for a more detailed discussion of theories of real wage
resistance during an economic downturn). In a situation of high unemployment,
wage growth becomes relatively stable around the recent level of underlying
inflation, so that real wages don’t fall sufficiently to clear the labor
market.
Our Phillips curve model relates
four-quarter growth in nominal compensation per hour (for the nonfarm business
sector) to economic slack, controlling for movements in trend productivity
growth and expected inflation. Our measure of slack is the Congressional Budget
Office (CBO) estimate of the unemployment gap—the percentage point deviation
between the actual unemployment rate and the CBO estimate of the natural rate
of unemployment. For trend productivity growth, we use an average of the
(annualized) quarterly growth rate of productivity. For expected inflation, we construct
a ten-year personal consumption expenditure (PCE) survey measure by adjusting
the Survey of Professional Forecasters’ ten-year expected CPI inflation series
to account for the average differential between CPI and PCE inflation. As the chart
below shows, expected inflation has been extremely stable during the post-1997
period. To provide additional observations for estimation and to conduct the
analysis in a low-inflation environment with well-anchored expectations, we use
data that cover the period from 1997 through the present.

Our model relates economic slack to
an adjusted compensation measure, where we subtract the values of trend
productivity growth and expected inflation from the compensation growth series.
This adjustment imposes the standard restriction that increases in the real
wage rate equal increases in labor productivity in the long run. The chart below
provides a scatter plot of the adjusted compensation growth series and the unemployment
gap. Negative (positive) values of the unemployment gap represent conditions in
which unemployment is below (above) the natural rate of unemployment.

An examination of the scatter plot shows
that the general shape of the data points bears a close resemblance to the chart
of the nonlinear Phillips curve, and estimation of the model provides evidence
of a statistically significant nonlinear relationship between (adjusted)
compensation growth and slack. To better illustrate the nature of the estimated
nonlinearity, we consider a comparison based on the same percentage point
change in the unemployment gap. If the gap were to move from -1 percentage
point to -3 percentage points, then the four-quarter growth rate of
compensation would increase by 2.2 percentage points. If the unemployment gap were
to move from 3 percentage points (the current CBO estimate) to 1 percentage
point, then the rate would increase only by 1 percentage point.
We also consider two additional
criteria to evaluate the nonlinear Phillips curve model—within-sample fit and
out-of-sample forecast performance. The within-sample fit is based on
estimation of the model using data from the full sample to compare the
predicted and actual values of growth in compensation per hour. The
out-of-sample forecast performance is based on estimation of the model only using
data through 2007:Q4 on the unemployment gap, trend productivity growth, and
expected inflation. With the resulting estimated model, we input the actual
values of the unemployment gap, trend productivity growth, and expected
inflation during the post-2007:Q4 period to generate forecasts of compensation
growth. The first forecast corresponds to compensation growth from 2008:Q1 to 2009:Q1.
The next chart plots the
four-quarter change in compensation growth, the within-sample predictions, and
the post-2007:Q4 out-of-sample forecasts. While the within-sample predictions fail
to track some short-run movements in compensation growth, they do capture the
general movements in the series. Moreover, both the within-sample predictions
and out-of-sample forecasts capture the magnitude of the decline in
compensation growth since 2008 as well as its subsequent stability.

Our analysis suggests that a
nonlinear wage-inflation Phillips curve fits the data well during the post-1997
episode and complements the results of Fuhrer, Olivei, and Tootell, who find
evidence of a nonlinear relationship between price inflation and activity gap
measures. An important conclusion from our analysis is that recent stability in
the growth rate of labor compensation measures may not be informative about the
extent of slack or its change. That is, stability in labor compensation
measures doesn’t imply that the output gap has closed, while changes in the
output gap may only have a modest impact on compensation growth.
In an inflation environment where
actual and expected price changes are low, someone might interpret the earlier
scatter plot as reflective of downward nominal wage rigidity—the idea that
workers and firms have incentives to avoid reductions in nominal wages. However,
the nonlinearity between wage growth and slack appears to be evident in other
episodes in which large fluctuations in real activity were accompanied by high
inflation and high compensation growth (this point is also discussed by Fuhrer,
Olivei, and Tootell). Thus, the mild trade-off between compensation/wage growth
and resource slack when slack is sizable isn’t unique to recent experience. Moreover,
the source of the nonlinearity must stem from downward real wage rigidity, as downward
nominal wage rigidity can generate this feature only in a low-inflation
environment.
We recognize that our analysis comes
with important caveats, which include the use of a model based on a simple,
parsimonious specification as well as the study of a single, short sample
period. Nevertheless, if the nonlinear relationship between slack and
wage/price inflation is an important feature of the data, then it will be
critical for policymakers to identify other indicators that may be more
responsive to slack and provide a quick and more reliable read on its
movements.
Disclaimer
The views expressed in this post are those of the authors and do not necessarily reflect the position of the Federal Reserve Bank of New York or the Federal Reserve System. Any errors or omissions are the responsibility of the authors.

M.
Henry Linder is a research associate in the Research and Statistics Group of
the Federal Reserve Bank of New York.

Richard
Peach is a senior vice president in the Research and Statistics Group of the
Federal Reserve Bank of New York.

Robert
W. Rich is an assistant vice president in the Research and Statistics Group of the
Federal Reserve Bank of New York.
 RSS Feed
 Follow Liberty Street Economics