Meta Brown and Sydnee Caldwell
Student loans have soared in popularity over the past decade, with the aggregate student loan balance, as measured in the FRBNY Consumer Credit Panel, reaching $966 billion at the end of 2012. Student debt now exceeds aggregate auto loan, credit card, and home-equity debt balances—making student loans the second largest debt of U.S. households, following mortgages. Student loans provide critical access to schooling, given the challenge presented by increasing costs of higher education and rising returns to a degree. Nevertheless, some have questioned how taking on extensive debt early in life has affected young workers’ post-schooling economic activity.
To address this issue, we examine trends in homeownership, auto debt, and total borrowing at standard ages of entry into the housing and vehicle markets for U.S. workers.
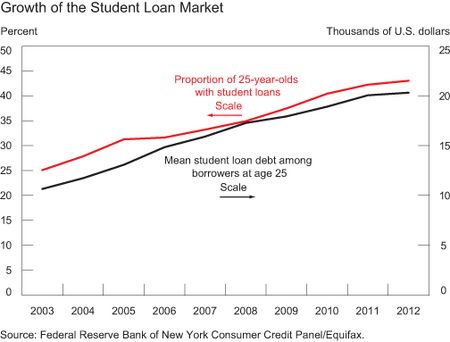
As seen in the chart below, the share of twenty-five-year-olds with student debt has increased from just 25 percent in 2003 to 43 percent in 2012. Further, the average student loan balance among those twenty-five-year-olds with student debt grew by 91 percent over the period, from $10,649 in 2003 to $20,326 in 2012. Student loan delinquencies have also been growing, as shown in the recent presentations by New York Fed economists Donghoon Lee and Wilbert van der Klaauw.
Student debt and subsequent homeownership
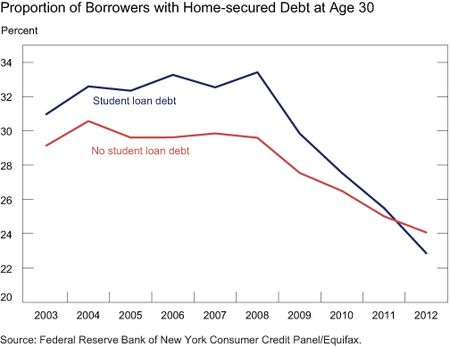
According to the National Association of Realtors, the median age at first home purchase has, historically, been stable at around thirty years of age. While roughly a third of homeowners own their homes outright, this is true of only a small minority of young homeowners. Hence we take the presence of home-secured debt as an indicator of homeownership among thirty-year-olds in the Consumer Credit Panel. The next chart shows the trends in the rates of (inferred) homeownership over the last decade for thirty-year-olds with and without histories of student debt.
Unsurprisingly, homeownership rates between 2003 and 2009 were significantly higher for thirty-year-olds with a history of student debt than for those without. Student debt holders have higher levels of education on average and, hence, higher incomes. These more educated consumers are more likely to buy homes. The homeownership difference between student debt holders and others expanded during the housing boom: by 2008, the homeownership gap between the two groups had reached 4 percentage points, or almost 14 percent of the nonstudent debtors’ homeownership rate.
However, this relationship changed dramatically during the recession. Homeownership rates fell across the board: thirty-year-olds with no history of student debt saw their homeownership rates decline by 5 percentage points. At the same time, homeownership rates among thirty-year-olds with a history of student debt fell by more than 10 percentage points. By 2012, the homeownership rate for student debtors was almost 2 percentage points lower than that of nonstudent debtors.
Now, for the first time in at least ten years, thirty-year-olds with no history of student loans are more likely to have home-secured debt than those with a history of student loans.
Student debt and vehicle purchases
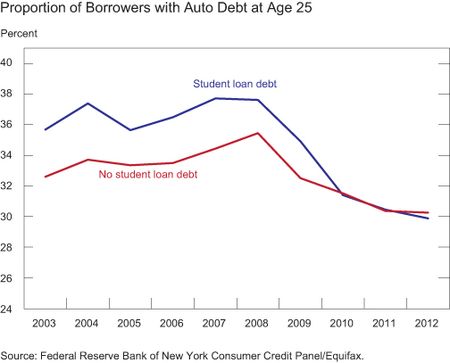
Vehicle purchases tend to predate home purchases for U.S. consumers, and so we look at auto debt at age twenty-five as an indicator of this common post-schooling economic activity. Auto debt is a less effective proxy for auto ownership than home-secured debt is for homeownership, since many young workers inherit older vehicles or purchase them outright. However, our auto debt data provide some indication of the rates at which young consumers participate in markets for new and late-model used cars.
As seen in the above chart, vehicle market participation for the young closely mimics housing market participation. Historically there has been a 3-to-4 percentage point gap between the auto debt rates of those with and without past student debt. As in the case of homeownership, those with a history of student debt were more likely to make debt-funded purchases of automobiles throughout the housing boom. While both groups saw steep declines in their use of auto debt from 2008 to 2012, the drop-off in debt-funded auto purchases was particularly steep for student borrowers. In 2011, the two trends intersected and, by the fourth quarter of 2012, those student borrowers were actually less likely to hold auto debt than nonborrowers.
Student debt and total borrowing
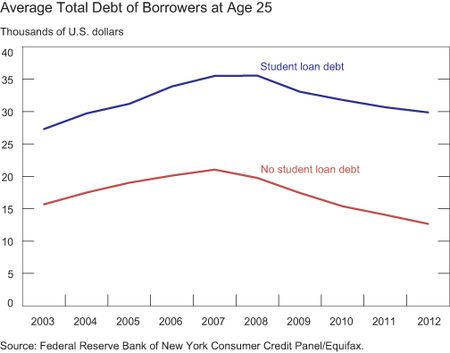
Putting these three trends together, we turn to the behavior of total debt per capita for the young over the past decade. While evidence on the rapid growth of the student loan market has raised concerns about the effects of the associated debt burden on younger generations of U.S. consumers, the decline in student borrowers’ use of other debt during the Great Recession has overwhelmed the observed student loan growth. As a result, although per borrower student debts are larger than ever, the total debt per capita of student borrowers and nonstudent borrowers followed approximately parallel increases during the boom, and approximately parallel declines during the Great Recession.
The above chart depicts total debt per capita among twenty-five-year olds who are and are not observed to hold any student debt between the ages of twenty-two and twenty-five. While average debt levels are considerably higher for student borrowers, with a peak of $35,559 in 2008 as compared with $19,748 for others, the trends in the two series are strikingly similar. Per capita consumer debt declined by $7,095 from 2008 to 2012 among the nonstudent borrowers. Over the same period, per capita student loan debt for the student borrowers rose by $9,677, and their per capita nonstudent loan debt declined by $15,364, more than twice the decline for the nonstudent borrowers. On net, student borrowers’ per capita debt declined by $5,687. Despite unprecedented growth in the student loan market, student borrowers appear to have participated fully in the recent consumer deleveraging. This was possible only through a collective retreat from other standard debt markets.
The decline in participation in nonstudent debt markets by those with a history of educational debt may be driven by a number of factors. First, a weakening in the labor markets since 2007—near the peak of consumer debt—has likely lowered graduates’ expectations of their future income. The decline in participation in the housing and auto debt markets may be a result of graduates decreasing their consumption, and thus debt, levels in response to these lowered expectations.
However, there is a second factor that could also be driving these changes: access to credit. In response to the recent recession and credit crunch, lenders have tightened underwriting standards in all major consumer debt markets. Consumers with substantial student debt may not be able to meet the stricter debt to income (DTI) ratio standards that are now being applied by lenders. In addition, delinquency in repayment has become more prevalent among student borrowers. Lee finds that delinquent student borrowers are extremely unlikely to originate new mortgages.
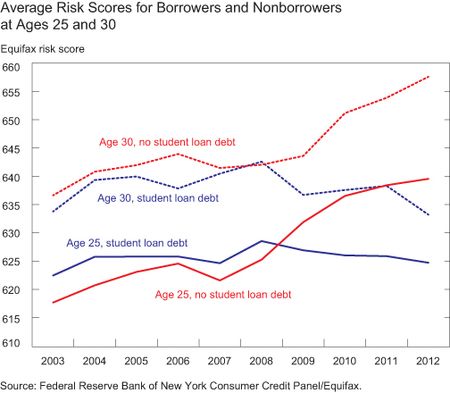
Our own analysis demonstrates a divergence in the credit scores of student borrowers and nonborrowers. The chart below shows trends in mean Equifax risk scores for twenty-five- and thirty-year-old borrowers with and without student debt histories. The trends for twenty-five-year-olds with and without student loans, and those for thirty-year-olds with and without student loans, lie on average 3 points apart from 2003 to 2008. From 2008 to 2012, however, the student-loan trends diverge from the no-student-loan trends. By 2012, the average score for twenty-five-year-old nonborrowers is 15 points above that for student borrowers, and the average score for thirty-year-old nonborrowers is 24 points above that for student borrowers. As a result of tighter underwriting standards, higher delinquency rates, and lower credit scores, consumers with educational debt may have more limited access to housing and auto debt and, as a result, more limited options in the housing and vehicle markets, despite their comparatively high earning potential.
Both these factors—lowered expectations of future earnings and more limited access to credit—may have broad implications for the ongoing recovery of the housing and vehicle markets, and of U.S. consumer spending more generally. While highly skilled young workers have traditionally provided a vital influx of new, affluent consumers to U.S. housing and auto markets, unprecedented student debt may dampen their influence in today’s marketplace.
Disclaimer
The views expressed in this post are those of the authors and do not necessarily reflect the position of the Federal Reserve Bank of New York or the Federal Reserve System. Any errors or omissions are the responsibility of the authors.
Meta Brown is a senior economist in the Federal Reserve Bank of New York’s Research and Statistics Group.
Sydnee Caldwell is a senior research analyst in the Research and Statistics Group.



 RSS Feed
 Follow Liberty Street Economics
Thanks very much to each of you for your thoughtful comments. We are indeed privileged to work with these data. Regarding student loan repayment and access to credit in a forward-looking sense, we have not considered those who had student loans but completed repayment separately from those still in repayment, so we can’t say much. However, it is clear that completing repayment of student loans influences one’s credit report, and lowers one’s debt to income (DTI) ratio. Both of these items are typically considered by lenders. Finally, while we do not have age-specific mortgage and auto debt series prepared for circulation, we are working with these data and we hope to share findings relating to the age patterns of these debts in the future.
Do you have the mortgage and auto debt data for all age groups? Is is possible to get the data series? Thanks
Very informative article. Thanks for the information and detailed analysis. Consumers with educational debt may have more limited access to housing and auto debt and more, and I’m one of it. Am I still will be influenced by this if I clear my education loan?
Thank you. That is a lot of really nice data and analysis, and the credit score divergence is something I had never seen presented before.