This post presents an update of the economic forecasts implied by the Federal Reserve Bank of New York’s (FRBNY) dynamic stochastic general equilibrium (DSGE) model, which we first introduced in a series of blog posts in September 2014. The model continues to predict a gradual recovery in economic activity, but one that will proceed at a slightly slower pace than was forecast in our April update. It also predicts a slow return of inflation toward the Federal Open Market Committee’s (FOMC) long-run target of 2 percent. This forecast remains surrounded by significant uncertainty. Please note that the DSGE model forecasts are not the official New York Fed staff forecasts, but only an input to the overall forecasting process at the Bank.
Recall from our earlier series that the FRBNY DSGE model uses modern economic theory to characterize the equilibrium evolution of important macroeconomic variables and identify the underlying shocks that perturb the economy. This model is estimated using Bayesian statistical techniques, combining prior information on model parameters with a dozen data series. The DSGE model evolves over time as we enhance and augment it to provide information about a growing set of economic variables. Accordingly, the forecasts presented here are obtained using an improved version of the FRBNY DSGE model discussed previously. The codes used for estimating the model are available here; the next post in this series will introduce codes used for estimating the model in a new (and free!) programming language called Julia, so stay tuned for that post.
The current version of the FRBNY DSGE model builds on the New Keynesian model with financial frictions used in Del Negro, Giannoni, and Schorfheide (2015), which has been shown to provide a reasonable explanation for the behavior of inflation in the aftermath of the Great Recession, and relatively accurate forecasts of output growth and inflation throughout recent history (see this post and this chapter in the Handbook of Economic Forecasting). Relative to the version of the FRBNY DSGE model described in April, the set of observable indicators is augmented with data on real gross domestic income (GDI), which, when combined with gross domestic product (GDP), provides a potentially more accurate measure of overall economic activity. We extended the model in this dimension because it is well known that GDI and GDP sometimes provide different signals about the state of the economy. We therefore use both as “noisy” measures of true underlying output growth in the spirit of the GDPplus measure proposed by Aruoba, Diebold, Nalewaik, Schorfheide, and Song (2013).
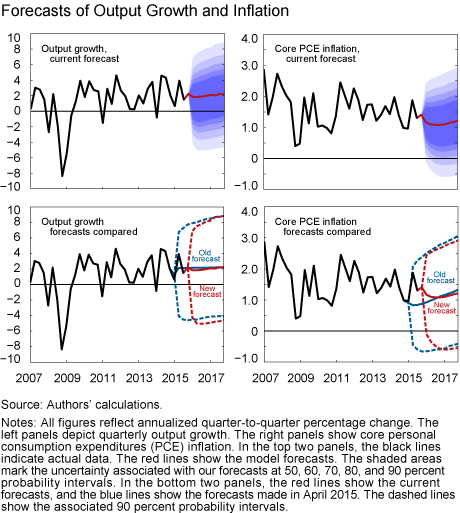
The top panel in the chart below presents quarterly forecasts for real GDP growth and the core PCE inflation rate over the 2015:Q4–2017:Q4 horizon. These forecasts were produced on November 13 using data released through 2015:Q3, augmented for 2015:Q4 with a “nowcast” for GDP growth, core PCE inflation, and growth in total hours, and 2015:Q4 observations for financial variables. Nowcasts incorporate up-to-date information that tends to improve short-run forecasts, as shown here. The black line represents released data, the red line is the forecast, and the shaded areas mark the uncertainty associated with our forecasts at 50, 60, 70, 80, and 90 percent probability intervals. Output growth and inflation are expressed in quarter-to-quarter percentage annualized rates.

The FRBNY DSGE forecast for output growth is very similar to, albeit slightly weaker than, the forecast in our earlier blog post, which used data ending in April 2015. This difference is highlighted in the bottom left panel of the chart, which compares current (solid red line) and April (solid blue line) forecasts. The model projects that the economy will grow 2.1 percent in 2015 (Q4/Q4), 1.8 percent in 2016, and 2.1 percent in 2017. The modest downward revision in our 2016 and 2017 GDP growth forecasts is mainly attributable to increases in credit spreads registered in the last several months, which set back the improvement in economic and financial conditions.
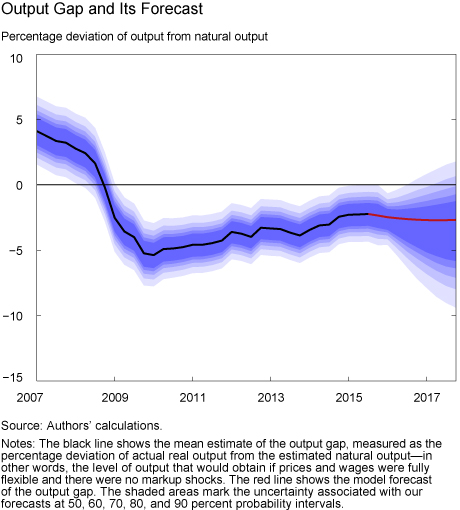
This setback is reflected in the model-implied “output gap” shown in the chart below. The output gap is defined as the percentage deviation of actual output from its “natural” level—that is, the counterfactual level of output that would obtain in an economy where nominal rigidities and markup (or cost-push) shocks are absent. The recovery in the output gap has been relatively slow, with economic activity remaining below its natural level since the end of 2008 and projected to remain so throughout the forecast horizon. Although there is much uncertainty about the gap forecast, the model predicts a slower narrowing of the output gap going forward than it did in April, largely because of the recent deterioration in financial conditions.

This chart suggests that there is still slack—that is, underutilized capacity—in the economy. The slack also reflects low marginal costs of production for firms—a key driver of the inflation projections. The model’s estimate of firms’ marginal costs suggests that these have not recovered much over the last few years owing to the weakness in real wage growth. As a consequence, inflation projections are weak, with core PCE inflation expected to remain below 1.5 percent until the end of 2017. The model forecasts slightly above average real wage growth over the next few years, but such increases in future real wages and marginal costs are not suggesting strong incoming inflationary pressures. They are instead necessary for the convergence of inflation toward the FOMC long-run objective. In the absence of accelerating wages, inflation projections would be even weaker.
The change in inflation forecasts relative to those reported last May reflects stronger-than-expected inflation data caused by the temporary increase in energy prices in 2015:Q2. However, this effect is expected to dissipate over the next few months and to be followed by a very gradual return to the 2 percent target. Uncertainty around the forecasts is significant, particularly for GDP growth. The width of the 68 percent probability interval for GDP growth is 4.8 percentage points in 2016 and 5.3 percentage points in 2017. The 68 percent probability intervals for inflation remain relatively tight, ranging from 0.4 percent to 1.7 percent in 2016 and from 0.3 percent to 1.9 percent in 2017. Note that the risks are skewed to the downside for output growth because of the constraint on policy imposed by the zero lower bound.
Market participants’ expectations about monetary policy are a key determinant of the model’s forecast because they affect the evolution of long-term interest rates. For the period running from 2008 to 2015:Q2, the effects of forward guidance, or more generally of the Fed’s communication, are incorporated in the model by conditioning the model’s forecasts of future policy rates on financial market expectations of the path of the federal funds rate. Since 2015:Q3, we have let the model set the path of the policy rate according to the “historical” interest rate rule, the one that we estimated over the pre-zero-lower-bound period. The projected path of the federal funds rate is, however, very similar to that implied by financial market expectations observed at the time of the forecast. The model predicts that the federal funds rate will return slowly to its long-run level.
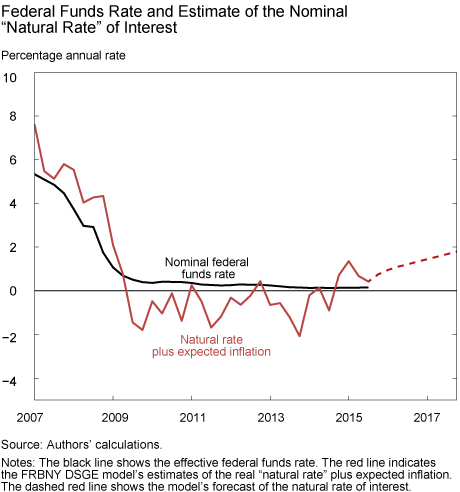
As discussed in this earlier blog post, the FRBNY DSGE model makes it possible to determine the natural rate of interest—that is, the equilibrium interest rate that would obtain if prices and wages were perfectly flexible, so that output and employment would be at their “potential” if there were no shocks to the markup on goods and labor markets. The red line in the chart below shows the model’s updated estimate of the nominal natural rate of interest (in other words, the sum of the real natural rate of interest and expected inflation) along with its forecast. For comparison, the chart also shows the recent evolution of the nominal federal funds rate (the solid black line).

As emphasized previously, the natural rate fell sharply during the crisis, from above 6 percent in early 2007 to about -2 percent in mid-2009. The natural rate was slightly above the actual rate for the period preceding the Great Recession, and well below it for the entire post-Recession period, indicating that the zero lower bound imposed a constraint on interest-rate policy. The natural rate is currently close to the actual rate, suggesting that policy is not particularly accommodative. Looking ahead, the natural rate is projected to increase at a slow pace, as the headwinds that brought down the natural rate during the crisis abate.
In conclusion, the FRBNY DSGE model continues to predict a gradual recovery in economic activity with a slow return of inflation toward the FOMC’s long-run target of 2 percent, as the negative effects of the Great Recession dissipate. This forecast, of course, remains surrounded by significant uncertainty.
Disclaimer
The views expressed in this post are those of the authors and do not necessarily reflect the position of the Federal Reserve Bank of New York or the Federal Reserve System. Any errors or omissions are the responsibility of the authors.

Marco Del Negro is an assistant vice president in the Federal Reserve Bank of New York’s Research and Statistics Group.

Marc Giannoni is an assistant vice president in the Group.

Erica Moszkowski is a research analyst in the Group.


 RSS Feed
 Follow Liberty Street Economics