Note: Updated versions of the charts in this post showing data through March 31, 2016, can be viewed here.
In a 2014 post, we described what settlement fails are, why they arise and matter, and how they can be measured. A subsequent post explored the determinants of the increased volume of U.S. Treasury security settlement fails in June 2014. Part of that episode reflected a steady increase in settlement fails of seasoned securities. In this post, we explore the characteristics of seasoned fails in recent years, in order to better understand the risks associated with such fails.
Settlement Fails and Counterparty Credit Risk
One concern with settlement fails is that they can increase counterparty credit risk. Counterparties to a trade can be exposed to such risk between the time the trade is negotiated and the time it is settled (although margin provisions and mark-to-market provisions—which are used by some market participants—can mitigate such risks). Settlement fails can exacerbate such risks because prices will tend to deviate further and further from agreed-upon transaction prices as time passes. The extent of risk buildup depends on a number of characteristics of the fails—which we explore here—including the duration of the fail, concentration of fails by security, and the price sensitivity of the securities that have failed to settle.
Seasoned Fails Continue to Rise
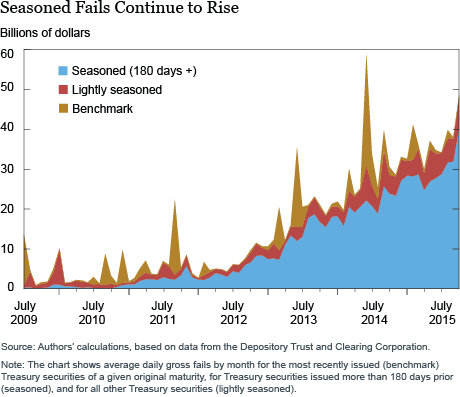
To start, we note that fails in seasoned Treasury securities have risen since our last post. To be sure, aggregate Treasury security settlement fails have come down since June 2014 as the spike in fails of recently issued securities subsided. Nonetheless, fails in seasoned issues—defined as securities issued more than 180 days prior—continued their upward trend after June 2014, as shown in the chart below.
More Issues Failing or Larger Fail Amounts per Issue?
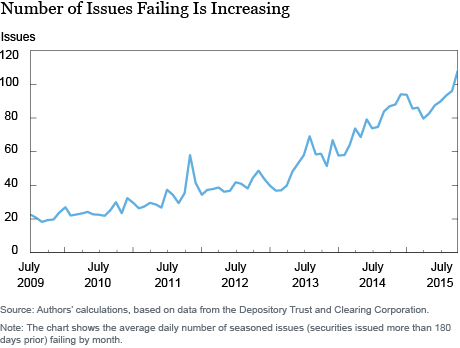
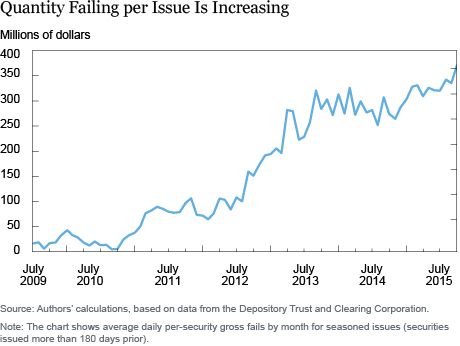
The volume of settlement fails on any given day reflects the product of the number of issues failing and the average quantity failing per issue. So which of these factors does the increasing volume reflect? As shown in the charts below, both factors are in play. That is, the number of different seasoned issues failing has been rising over time and the average quantity of fails per issue has also been increasing.
More Fails Episodes or Longer Episodes?
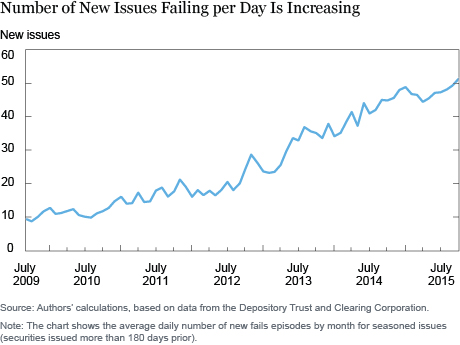
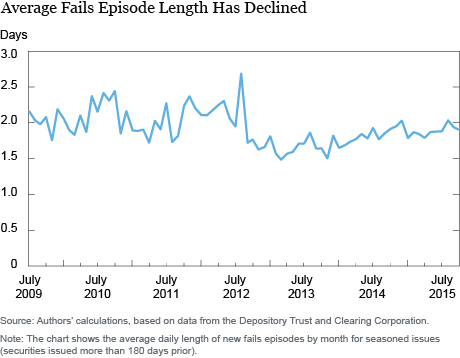
More issues failing on a given day may reflect an increase in the number of fails episodes or an increase in the average length of such episodes. Which is it? To gauge the number of fails episodes, we calculate the number of new fails episodes for each day in our sample. To gauge the average length of such episodes, we calculate the average number of consecutive business days each failing security failed for each day in our sample. The chart below plots the monthly averages of these two series and shows that the increasing number of fails outstanding on a given day is coming from more frequent fails episodes and not from longer fails episodes. In fact, the average fails episode length has declined in recent years. As discussed earlier, shorter duration fails result in less credit risk than more aged fails.
Are Fails Concentrated in a Few Issues?
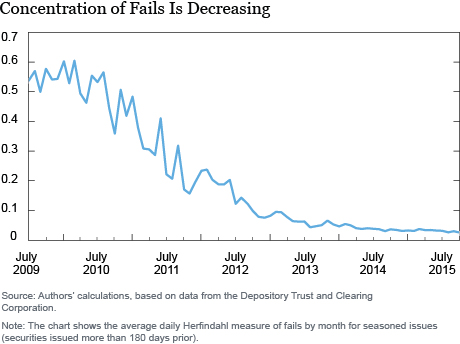
We know from our earlier chart depicting the number of new issues failing that settlement fails are occurring in many issues, but does this reflect a broad distribution of fails, or is the vast majority of fails volume accounted for by a small number of issues? To answer this question, we construct a Herfindahl measure of seasoned fails concentration for each day in our sample. The chart below plots the monthly average of this series and shows that the concentration of fails across issues has decreased markedly over time, implying that fails are occurring across an increasingly wide range of issues.
Are Fails Concentrated in Certain Types or Tenors of Securities?
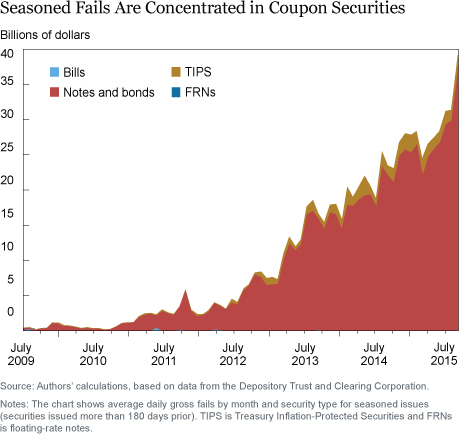
The chart below shows that seasoned fails predominantly occur in fixed-principal notes and bonds, and not in bills, Treasury Inflation-Protected Securities, or floating-rate notes. This is not too surprising given that such notes and bonds account for the vast majority of outstanding Treasury debt (79 percent as of October 31, 2015). (Moreover, one would not expect many seasoned fails in bills because most bills outstanding mature in less than 180 days and hence cannot be seasoned by our definition.)
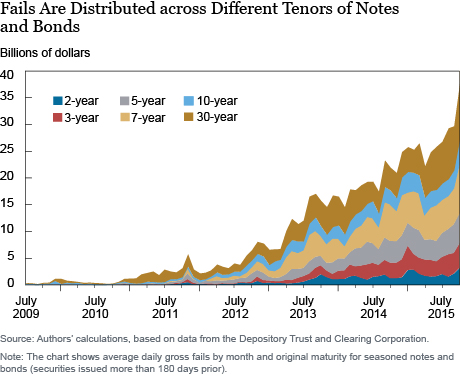
That said, seasoned fails are widely distributed across the different tenors of fixed-principal notes and bonds, as shown below.
Are Fails Concentrated in Certain Vintages of Securities?
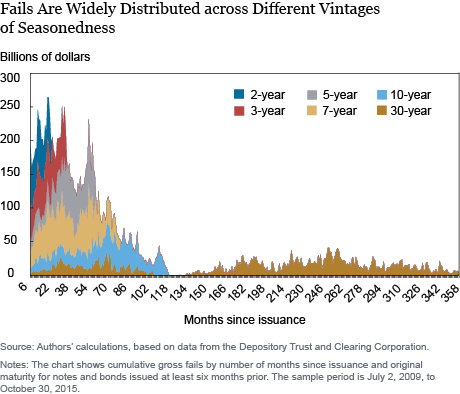
While seasoned fails are widely distributed across different tenors of securities, are they concentrated within certain vintages of seasonedness? For example, do the fails tend to arise for more recently issued securities, such as in the period between 180 and 360 days after issuance, or are such fails still common for securities closer to maturity? The chart below shows that seasoned fails are widely distributed by time since issuance. While there tends to be some falloff as securities age, the outstanding supply of aged securities also falls over time as securities mature. For example, there are naturally no fails of three-year notes more than three years since issuance, but the fails of three-year notes in the period from 181 days to three years after issuance are fairly evenly distributed by security age.
A Set of Stylized Facts
This post establishes a set of stylized facts about the duration and security characteristics of seasoned settlement fails in U.S. Treasury securities. Seasoned fails have been trending upward, and this increase can be explained by more issues failing and in larger quantities, but not by longer fails episodes. Moreover, the fails are increasingly dispersed across securities, with little apparent concentration in particular tenors or vintages of securities. Going forward, the continued growth in seasoned fails bears close watching, even as concerns are somewhat mitigated by the short tenure and wide dispersion of the fails.
Disclaimer
The views expressed in this post are those of the authors and do not necessarily reflect the position of the Federal Reserve Bank of New York or the Federal Reserve System. Any errors or omissions are the responsibility of the authors.
 Michael J. Fleming is a vice president in the Federal Reserve Bank of New York’s Research and Statistics Group.
 Frank M. Keane is an assistant vice president in the Bank’s Markets Group.


 RSS Feed
 Follow Liberty Street Economics