Today, the New York Fed is introducing a number of new data series and interactive charts reporting findings from its Survey of Consumer Expectations (SCE). Since January 2014, we have been reporting findings from this monthly survey on U.S. households’ views on inflation, commodity prices, the labor market and household finances. In addition to interactive charts showing national trends (going back to June 2013), as well as trends by demographic groups (age, income, education, numeracy and geography), we also make the underlying micro data (with a nine-month lag) available for download for research purposes.
As described in a series of blog posts, the SCE is a representative, Internet-based monthly survey of a rotating panel of about 1,300 heads of household in the United States. Besides its longitudinal nature (which permits tracking beliefs of the same individuals for up to twelve months), the SCE elicits consumers’ expectations on a broad variety of topics, covering both macroeconomic variables (such as inflation, home price changes, unemployment, and credit availability) and individual future outcomes (such as wage growth, the likelihood of losing or finding a job, household income, and spending growth). Importantly, in eliciting subjective expectations for certain variables, we also collect data on the individual’s forecast uncertainty.
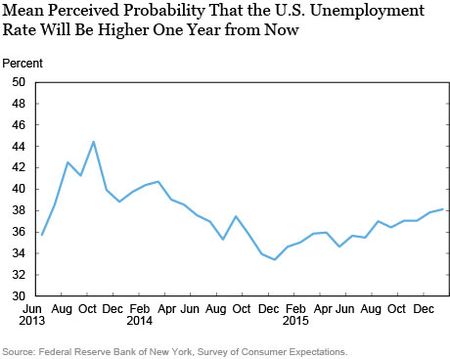
Our initial data releases and interactive charts focused on a subset of expectations. Today, we expand our analysis by adding five new data series. The first series reports respondents’ expectations of higher unemployment twelve months from now. As shown in the chart below, the mean probability that the U.S. unemployment rate will be higher one year from now fell from a high of 44 percent in October 2013 to a low of 33 percent in December 2014. Since then we have seen a slight gradual increase in the probability to 38 percent in January 2016. Our interactive charts, which show trends separately by demographic groups, reveal that this trend is common across most groups. We also observe that older respondents are generally a little more optimistic and respondents from lower-income households are slightly more pessimistic about the change in the U.S. unemployment rate.

In the second series, we consider consumers’ perceptions and expectations about their overall financial situation. More specifically, using questions similar to those used in the University of Michigan’s Survey of Consumers, respondents are asked whether they (and their family) are financially better or worse than they were twelve months ago, and whether they expect to be better or worse off twelve months from now. The data show a steady increase in expectations from a low in October 2013 when only 30 percent of respondents reported expecting to be better off twelve months from now (and 25 percent expecting to be worse off), to a high in April 2015 when 42 percent expected to be better off (and 14 percent expected to be worse off).
Since April 2015 expectations have become slightly less optimistic, with 37 percent of respondents in January 2016 expecting to be somewhat or much better off a year from now, and 17 percent expecting to be worse off. We find a similar pattern for past-year changes, seeing an increase in the proportion of respondents who reported being better off than a year ago, until the summer of 2015, after which we see a slight decline. In January 2016, 29 percent of respondents said they were better off than a year ago, while 26 percent said they were worse off.
Expectations about stock prices, the third new series, have remained markedly stable since June 2013, with respondents, on average, assigning a 40 percent probability that stock prices will be higher a year from now. Comparing different demographic groups, we find that the average probability of higher stock prices never exceeds 50 percent. Relative to other groups, younger (under age 40), college-educated, higher-income and higher-numeracy respondents are more optimistic on average. In January 2016, college-educated respondents and those with at most a high school diploma assigned an average probability of 45 percent and 34 percent, respectively, to an increase in stock prices over the following twelve months.
The fourth new series measures the median point prediction of the expected change in gold prices over the next twelve months. The data series shows a slight downward trend over the past two and a half years, declining from an average of 2.9 percent during the second half of 2013, to an average of 2.6 percent and 2.3 percent during 2014 and 2015, respectively. In January 2016, respondents expected a 2.1 percent increase in the price of gold over the next year.

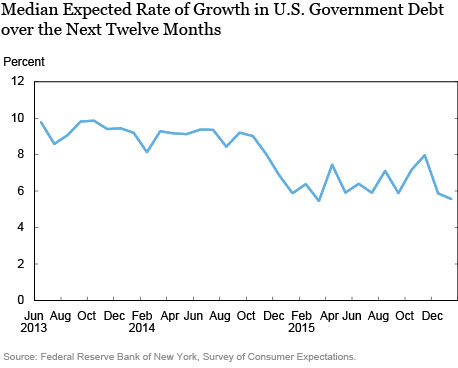
Finally, we ask survey respondents by how much they expect government debt to grow over the next year. As shown in the chart above, until November 2014 the median predicted growth rate in government debt was 9 percent (varying between 8 and 10 percent), after which it fell to around 6 percent during 2015. Younger, more educated, and higher-income respondents on average expect lower government debt growth. In January 2016, those under age 40, and college-educated respondents on average expect a 4.8 percent and 5.1 percent growth rate, respectively.
We believe these additions to the set of interactive charts and data from the SCE will help the public gain a fuller understanding of the perceptions and expectations of U.S. households regarding a broad variety of economic and financial topics.
Disclaimer
The views expressed in this post are those of the authors and do not necessarily reflect the position of the Federal Reserve Bank of New York or the Federal Reserve System. Any errors or omissions are the responsibility of the authors.

Olivier Armantier is an assistant vice president in the Federal Reserve Bank of New York’s Research and Statistics Group.

Giorgio Topa is a vice president in the Bank’s Research and Statistics Group.

Wilbert van der Klaauw is a senior vice president in the Bank’s Research and Statistics Group.

Basit Zafar is a research officer in the Bank’s Research and Statistics Group.


 RSS Feed
 Follow Liberty Street Economics