


After a period of stability, oil prices started to decline in mid-2015, and this downward trend continued into early 2016. As we noted in an earlier post, it is important to assess whether these price declines reflect demand shocks or supply shocks, since the two types of shocks have different implications for the U.S. economic outlook. In this post, we again use correlations of weekly oil price changes with a broad array of financial variables to quantify the drivers of oil price movements, finding that the decline since mid-2015 is due to a mix of weaker demand and increased supply. Given strong interest in the drivers of oil prices, the oil price decomposition is information we will be sharing in a new Oil Price Dynamics Report on our public website each Monday starting today. We conclude this post using another model that finds that the higher oil supply boosted U.S. economic activity in 2015, though this impact is expected to wear off in 2016.
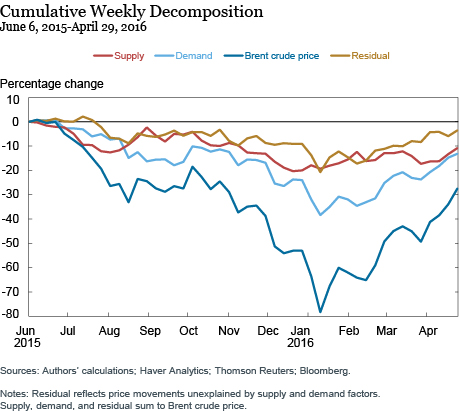
As described in our post last year, we use a model to distinguish demand and supply shocks on oil prices based on correlations of oil price changes with a large number of financial variables. We updated the model here using data through late April 2016. The chart below shows oil price changes along with the model-implied supply and demand drivers of prices cumulated from early June 2015 (when the last post was published) to late April 2016. The initial fall in oil prices between early June and early August was due mainly to supply factors, while the subsequent drop-off into September was demand-driven (due largely to China-related global financial market turmoil in August). Demand was again a large contributor to the drop in oil prices at the end of last year.
The next chart zooms in on the oil price developments from early October 2015 to late April 2016, focusing on oil price changes and identifying demand and supply contributions in this period. This illustration clarifies that the pull on oil prices over the course of the fourth quarter was due to oversupply concerns, with increased expectations that the oil export restrictions for Iran would be lifted. In January, global demand perceptions following a renewed meltdown in Chinese financial markets drove oil prices further down. More recently, however, with the easing of global economic and financial uncertainty, reassessments of global demand expectations have pushed oil prices higher.

So, what are the implications of these oil price developments for U.S. economic activity? We use a statistical model incorporating contemporaneous and lagged data for GDP growth, real PCE growth, and real nonresidential business fixed investment spending growth (split up into oil and mining sector and non-oil investment spending) plus some additional variables to identify the impact of oil supply shocks on the economy. Our estimated supply component of oil price changes then becomes an instrumental variable for the unexplained part of the model (the residuals), helping us identify the macroeconomic implications of oil supply shocks.
We estimate the impact of the model-identified supply shocks on GDP, as well as its two main components, consumption and nonresidential business fixed investment spending (aggregated from the separate oil and mining and non-oil components). The panel of three charts below shows actual (annualized) growth rates (the blue lines), simulated growth rates using our model and assuming no additional shocks after the first quarter of 2016 (the gray lines), and the contribution of our oil supply shocks to these actual and simulated growth rates (the gold lines).
The expansionary oil supply shocks of the fourth quarter of 2014 and the first quarter of 2015 appear to contribute to about a third of the GDP growth in the first half of 2015, whereas the positive supply shocks of the second half of last year had a relatively larger positive contribution (albeit GDP growth slowed down over this period). Going forward, however, our model suggests that the contribution of these supply shocks dissipates fairly rapidly in 2016 and is estimated to be essentially zero from the second quarter of 2016 onward.
Turning to the middle chart in the panel below, we see that the 2014-15 expansionary oil supply shocks contribute, on average, to about half of the observed growth rate in consumption in 2015. And despite the contraction of oil-related investment spending, positive oil supply shocks are a main driver of nonresidential investment spending growth throughout the first half of 2015, but not for the final quarter of 2015 and the first quarter of this year, as can be seen in the bottom chart.

Our analysis suggests that excess supply was a significant driver of oil price weakness over the past year, although it was not a dominant determinant like in the second half of 2014. For the first quarter of 2016, the oil price decomposition did suggest a relatively stable supply and this implies little impact from oil prices on overall economic activity in the rest of this year.
Sign up for e-mail alerts for the Oil Price Dynamics Report.
Disclaimer
The views expressed in this post are those of the authors and do not necessarily reflect the position of the Federal Reserve Bank of New York or the Federal Reserve System. Any errors or omissions are the responsibility of the authors.

Jan J.J. Groen is an officer in the Federal Reserve Bank of New York’s Research and Statistics Group.

Patrick Russo is a senior research analyst in the Bank’s Research and Statistics Group.
How to cite this blog post:
Jan J.J. Groen and Patrick Russo, “Lower Oil Prices and U.S. Economic Activity,”
Federal Reserve Bank of New York Liberty Street Economics (blog), May 2, 2016,
http://libertystreeteconomics.newyorkfed.org/2016/05/lower-oil-prices-and-us-economic-activity.html.
 RSS Feed
 Follow Liberty Street Economics