


The growth in U.S. imports of goods has been stubbornly low since the second quarter of 2015, with an average annual growth rate of 0.7 percent. Growth has been even weaker for non-oil imports, which have increased at an average annual rate of only 0.1 percent. This is in sharp contrast to the pattern in the five quarters preceding the second quarter of 2015, when real non-oil imports were growing at an annualized rate of 8 percent per quarter. The timing of the weakness in import growth is particularly puzzling in light of the strong U.S. dollar, which appreciated 12 percent in 2015, lowering the price of imported goods relative to domestically produced goods. The trajectory for imports can affect the variety of goods consumed in the United States and could, if it is evolving independently, have implications for overall economic growth. To understand the consequences of lower import growth, it is important to understand what is behind this recent trend. In this blog post, we explore what has been driving the recent slump in U.S. imports of non-oil goods.
The recent patterns are depicted in the first chart, where we show real imports as a share of GDP. These measures actually fell in the last five quarters, reversing the upward trend that followed the Great Recession.

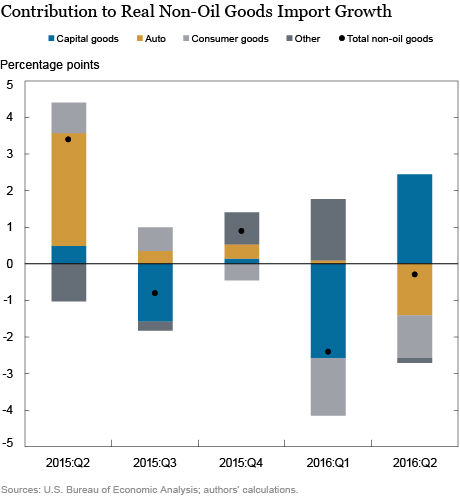
To identify the sources of this extraordinary weakness in recent import growth, we disaggregate imports into their major constituents (see the chart below). One notable element of the chart is that imports of capital goods were quite soft in the first four quarters shown. Early in 2015, this weakness in capital goods was due in part to declines in drilling-related equipment imports, while in the first quarter of 2016, it was due to other subcategories, such as telecommunications and aircraft. Another striking feature is the negative contribution from consumer goods in the period from the fourth quarter of 2015 through the second quarter of 2016: despite the strong dollar, U.S. consumers and retailers were not switching to imported goods.
 How has the recent slowdown in U.S. investment affected U.S. imports? The next chart shows that U.S. capital goods imports are very highly correlated with equipment investment—a category that excludes intangibles, residential investment, and changes in inventories. Equipment investment has been unusually weak, with its four-quarter percentage change falling into negative territory, which is unusual outside a recession period. These data suggest that the slowdown in import growth likely stems from whatever is behind the weakness in equipment, rather than from trade-specific factors such as trade policies or higher trade costs.

How does this observation qualify the usual approach to modeling imports? Standard economic models relate import growth to relative prices and income, and typically don’t focus on the components of aggregate demand, like equipment investment. These models predict that a stronger U.S. dollar should make U.S. imports cheaper relative to domestic goods and thus push up import demand; they predict, too, that higher income will translate into higher imports.
Although the recent slowdown in both dollar appreciation and U.S. income growth suggests that import growth might wane somewhat, the substantial weakness in U.S. imports remains puzzling. This is highlighted in the next chart, where we plot the four-quarter change in actual non-oil import growth and the out-of-sample predictions of the New York Fed baseline model. We estimate the model using quarterly data for the period 1980–2012, and proxy for income with domestic demand (the sum of consumption, investment, and government expenditure). As the chart shows, for the given values in domestic demand and relative prices (with appropriate lags), the model predicts year-over-year import growth well above actual import growth for every quarter since the second quarter of 2015.
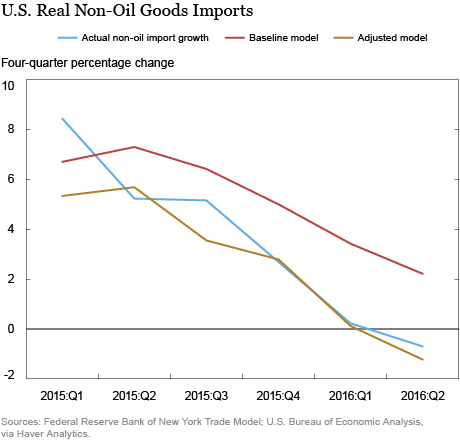
Drawing on information from our earlier charts, we next modify our baseline model of non-oil import growth to allow separate effects from the individual components of domestic demand. In particular, instead of including in the estimation the percentage change in overall domestic demand as a combined aggregate, we include the quarterly changes in private nonresidential equipment investment, consumer goods, and inventories as separate components. We then use these estimates to predict the out-of-sample growth in non-oil imports, and find that these changes improve the fit enormously. However, we are able to achieve a prediction that is even closer to actual import growth by reducing the sample period to start in 1990—this indicates that the underlying relationship has changed somewhat over time. In the chart above, the out-of-sample predictions for the adjusted model are represented by the gold line. Clearly, once we incorporate the individual key components of domestic demand and shorten the sample period, the predictions are much closer to the actual non-oil import growth. This analysis suggests that the recent slump in import growth is primarily a reflection of weakness in other parts of the U.S. economy rather than specific factors relating to the cost of international trade.
Disclaimer
The views expressed in this post are those of the authors and do not necessarily reflect the position of the Federal Reserve Bank of New York, the Federal Reserve Board, or the Federal Reserve System. Any errors or omissions are the responsibility of the authors.

Mary Amiti is an assistant vice president in the Federal Reserve Bank of New York’s Research and Statistics Group.

Tyler Bodine-Smith is a senior research analyst in the Bank’s Research and Statistics Group.
Colin Hottman is an economist in the Division of International Finance at the Federal Reserve Board.
Logan T. Lewis is an economist in the Division of International Finance at the Federal Reserve Board.
How to cite this blog post:
Mary Amiti, Tyler Bodine-Smith, Colin Hottman, and Logan T. Lewis, “What’s Driving the Recent Slump in U.S. Imports?” Federal Reserve Bank of New York Liberty Street Economics (blog), November 7, 2016, http://libertystreeteconomics.newyorkfed.org/2016/11/whats-driving-the-recent-slump-in-us-imports.html.
 RSS Feed
 Follow Liberty Street Economics