The possible adverse effects of regulation on market liquidity in the post-crisis period continue to garner significant attention. In a recent paper, we update and unify much of our earlier work on the subject, following up on three series of earlier Liberty Street Economics posts in August 2015, October 2015, and February 2016. We find that dealer balance sheets have continued to stagnate and that various measures point to less abundant funding liquidity. Nonetheless, we do not find clear evidence of a widespread deterioration in market liquidity.
Changes in Dealer Balance Sheets
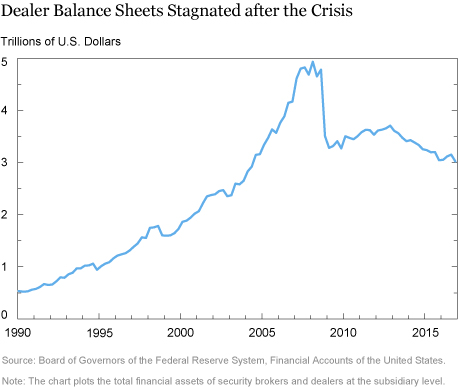
The stagnation of dealer balance sheets that began after the financial crisis of 2007-09 has persisted, as shown in the chart below. In the years running up to the crisis, dealer assets grew exponentially, peaking at around $5 trillion in early 2008. In late 2008, assets contracted sharply, to $3.5 trillion, their level in 2005, and at the end of 2016 reached $3.0 trillion.
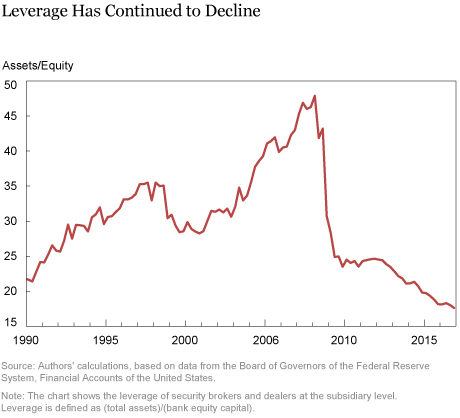
Dealer leverage (assets/equity) has followed a similar path, as seen in the next chart. Leverage peaked at 47.9 in the first quarter of 2008, around the near-failure of Bear Stearns, and then plunged to just 25.0 in the second quarter of 2009. Leverage remained fairly steady until 2012, but has since trended down, reaching 17.6 in late 2016.
Less Abundant Funding Liquidity
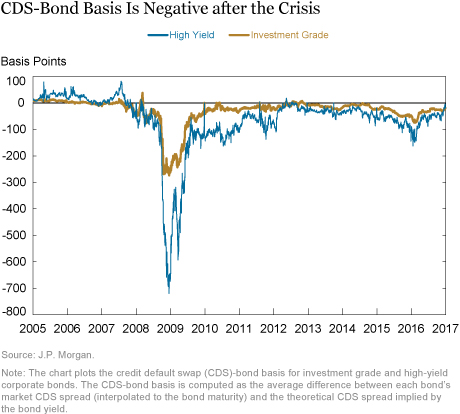
Consistent with stagnant dealer balance sheets, arbitrage measures suggest less abundant funding liquidity. The next chart, for example, plots the credit default swap (CDS)-bond basis, calculated as the average difference between each bond’s market CDS spread and the theoretical CDS spread implied by the bond yield. A basis different from zero suggests an arbitrage opportunity, and is indicative of dealers’ constraints, particularly funding constraints. The basis was close to zero, yet generally positive, before the crisis, but turned sharply negative during the crisis before rebounding, and has generally been moderately negative since the crisis. This blog post argues that increased funding costs possibly tied to regulatory constraints on dealer balance sheets can limit trading on this apparent arbitrage opportunity, as dealers must now hold more capital against such trades.
Drivers of the Changes
Many commentators attribute the funding market pressures and purportedly reduced market liquidity to the Dodd-Frank Act and the Basel III regulatory framework. Those regulatory reforms include higher bank capital requirements, new leverage ratios, and liquidity requirements. While these regulations are intended to make the U.S. and global financial system more resilient, some market participants argue that they also hinder market making by raising the cost of capital and restricting dealer risk-taking.
While it’s reasonable to think that regulations have affected both funding and market liquidity, the effects are difficult to pinpoint given various other factors affecting dealer balance sheets and liquidity in the post-crisis era. Such factors include voluntary changes in dealer risk-management practices and balance sheet composition since the crisis, the growth of electronic trading, the evolving liquidity demands of large asset managers, and changes in expected returns associated with the economic environment. Identifying how any single factor affects dealer balance sheets and liquidity must control for these other factors, which is especially difficult given that many are highly interrelated and driven by other developments.
Evolution of Market Liquidity
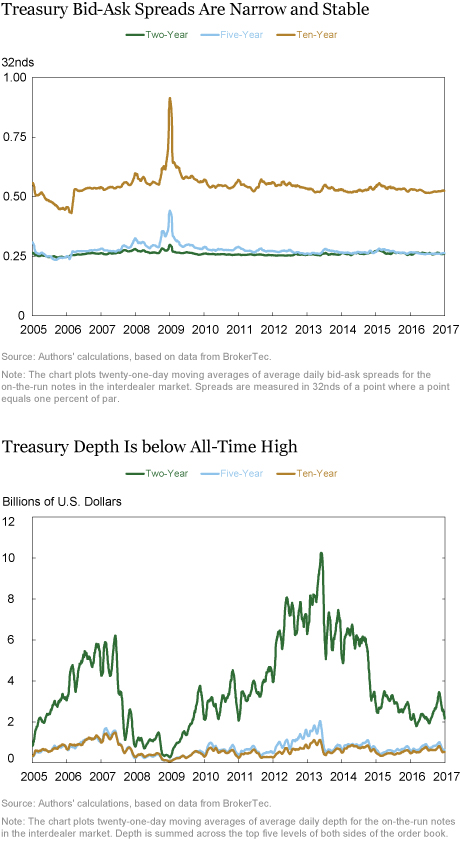
Turning to market liquidity, we find mixed evidence for the Treasury market. As of late 2016, average bid-ask spreads for benchmark notes in the interdealer market were narrow and stable—and comparable to pre-crisis levels, as shown in the chart below. In contrast, the subsequent chart reveals that “Treasury depth”—the average quantity of securities that can be traded at the best bid and offer prices—remains below levels seen right before the crisis and the 2013 sell-off in fixed income markets, albeit well above crisis levels. The evolution of the price impact of trades, shown here, similarly suggests a modest deterioration in liquidity since early 2013.
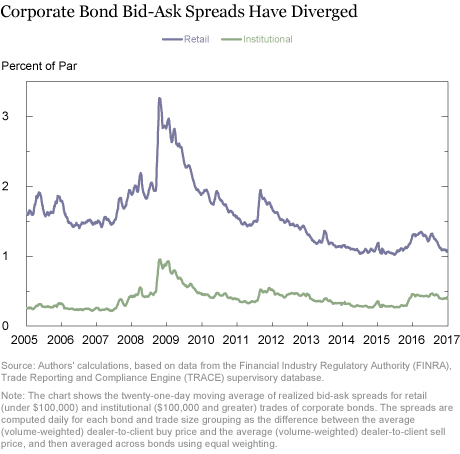
In the corporate bond market, liquidity appears to have diverged depending on trade size, which is often associated with investor type. The chart below thus shows that average realized bid-ask spreads (which are based on transaction data), have fallen below pre-crisis levels for retail-sized trades, but remain above pre-crisis levels for institutional-sized trades. Regardless, corporate bond trading and issuance volume have been robust, reaching record highs in 2016.
Liquidity Case Studies
Although liquidity under normal market conditions may not have significantly worsened, it might be that it has become more fragile, or prone to disappearing under stress (see, for example, Powell 2016). To address that prospect, we consider three case studies on the resilience of market liquidity since the crisis. The first analyzes dealer balance sheet behavior during the 2013 Treasury selloff—the “taper tantrum” when yields rose over 100 basis points over ten weeks. The second looks at the October 2014 “flash rally” in the Treasury market, when yields rose and fell sharply within a twelve-minute window. The third reviews how the liquidation of Third Avenue’s high-yield bond fund in December 2015 affected market liquidity. In all three instances, the degree of deterioration in market liquidity was within historical norms, suggesting that liquidity remained resilient even during stress events.
Further Work
While we do not find clear indications of a widespread worsening of bond market liquidity, our analysis faces several limitations, including important limits to available data. For example, our Treasury market metrics are from the interdealer market, and hence do not gauge liquidity in the dealer-to-customer market. Moreover, our corporate metrics are based on transactions data, and cannot account for the time required to trade or the liquidity of bonds that do not trade. To overcome these shortcomings, future work should consider a wider range of data to illuminate these blind spots. Indeed, as discussed in our blog post here, regulators will soon have access to a broader set of transactions data for the U.S. Treasury market.
In addition, dealer balance sheets have changed dramatically, and some funding cost metrics, such as the CDS-bond basis, imply increased balance sheet costs, suggesting important changes in dealer behavior. Exploring the determinants of such behavior and how dealer attributes affect market liquidity is a promising avenue of future work. This recent paper, for example, links changes in the liquidity of individual corporate bonds to financial institutions’ balance sheet constraints and finds that bonds traded by more levered institutions are less liquid, especially after the financial crisis.
Disclaimer
The views expressed in this post are those of the authors and do not necessarily reflect the positions of the Federal Reserve Bank of New York, the Federal Reserve System, the International Monetary Fund (IMF), the IMF’s executive directors, or the IMF’s management. Any errors or omissions are the responsibility of the authors.
Tobias Adrian is financial counsellor and director of the International Monetary Fund’s Monetary and Capital Markets Department. This blog is based on work that was completed while Adrian was with the Federal Reserve Bank of New York.

Michael J. Fleming is a vice president in the Federal Reserve Bank of New York’s Research and Statistics Group.

Or Shachar is an economist in the Federal Reserve Bank of New York’s Research and Statistics Group.
How to cite this blog post:
Tobias Adrian, Michael J. Fleming, and Or Shachar, “Market Liquidity after the Financial Crisis,” Federal Reserve Bank of New York Liberty Street Economics (blog), June 28, 2017, http://libertystreeteconomics.newyorkfed.org/2017/06/market-liquidity-after-the-financial-crisis.html.


 RSS Feed
 Follow Liberty Street Economics
Thank you both for your comments. In response to Alex, the financial assets of broker dealers are broken down into a number of different categories in the Financial Accounts of the United States, published by the Board of Governors of the Federal Reserve System. In particular, see Table L.130, in the Z.1 Statistical Release (most recent version is here: https://www.federalreserve.gov/apps/fof/DisplayTable.aspx?t=l.130). In response to Darrell, thank you for the great suggestion. A few recent papers (by Harris (2015), Bessembinder, Jacobsen, Maxwell, and Venkataram (2016), Choi and Huh (2017), and Goldstein and Hotchkiss (2017)) have examined the holding periods of dealers and their propensity to act as an agent (or riskless principal) over time. A challenge in estimating the time taken to execute a large total desired client trade is that observed trade sizes are not exogenous, but reflective of liquidity conditions.
Tobias, Michael, Or: Great work! In order to get at one of the issues that you raised, it may be possible to use the regulatory version of the TRACE data (which includes broker identifiers) to examine the length of time taken to liquidate or build a block-size position. My guess is that the big reductions in dealer balance sheet space devoted to corporate bonds that has occurred over recent years corresponds to a significant increase in the time taken to execute a large total desired client trade. Dealers are stingier with balance sheet space under tighter capital regulations, and should be less interested in absorbing large trades, and also be more likely to act as an agent or “riskless principal.” We also know that turnover has declined significantly. I have followed your series of postings on this topic at Liberty Street Economics, with great interest, and I always learn a lot from you. Please keep up the excellent research.
Thanks for the article. I was particularly intrigued by the first chart, the total assets on dealer balance sheets since 1990. In the years leading up to the crisis, I wonder how much of the increase was due to asset price appreciation as opposed to dealers actually taking on more inventory. Do you know where I could find the same type of chart, broken down by asset type? Treasuries, corporate bonds, structured products, etc? Thank you