


Short-term credit markets have evolved significantly over the past ten years in response to unprecedentedly high levels of reserve balances, a host of regulatory changes, and the introduction of new monetary policy tools. Have these and other developments affected the way monetary policy shifts “pass through” to money markets and, ultimately, to households and firms? In this post, we discuss a new measure of pass‑through efficiency, proposed by economists Darrell Duffie and Arvind Krishnamurthy at the Federal Reserve’s 2016 Jackson Hole summit.
Measuring Monetary Policy Transmission
In an idealized money market, efficiency is achieved by equating the marginal rates of substitution for credit supply and demand across all market participants. In this setting, any change in the Fed’s policy rate should pass through completely to all money market rates.
In reality, a number of frictions may impede pass‑through. For example, there are costs incurred through searching for and monitoring investment opportunities, as well as complex institutional or regulatory arrangements that restrict lending channels. Such frictional wedges can dampen competition for rates, ultimately impacting pass‑through.
Ideally, we would like to assess the relevance of such frictions using a measure that precisely captures how well changes in the federal funds target rate pass through to other short-term interest rates. In practice, however, measuring pass‑through efficiency poses several challenges. Which market rates should be considered and at what maturity points? How should different markets be weighted relative to one another? Do we care just about the level of those rates relative to the policy rate or about their dispersion as well? How should this measure be affected by a change in the policy rate? The empiricist faces additional challenges, including the limited availability of data on interest rates that are consistent across rates and time.
In a recent paper, Darrell Duffie and Arvind Krishnamurthy—both finance professors at Stanford University’s Graduate School of Business, as well as research associates at the National Bureau of Economic Research—propose a theoretical framework of the U.S. money markets to understand the impact that current institutional market features have on pass‑through efficiency. To assess the pass‑through issue empirically, they develop a dispersion index of money market rates, where higher dispersion corresponds to lower efficiency.
This measure—the volume-weighted average absolute deviation from the volume-weighted average rate—captures how much each market rate deviates from the average rate across markets. To implement the index, Duffie and Krishnamurthy adjust rates for term and credit spreads, and weight each instrument’s influence by its outstanding amount. This index is designed to equal zero in a world without any frictions, where all rates yield the same adjusted return, and to be constant in a world with perfect pass‑through, where all rates move in lockstep.
As shown in the chart below, the Duffie-Krishnamurthy (DK) dispersion index varies between 1 and 20 basis points for most of the sample (which runs from 2002 to mid-2016), except for notable spikes to as high as 100 basis points during the financial crisis—a period of significant stress in money markets. Looking toward the end of the sample, we see that the index shows a significant increase in dispersion around December 2015, when the Federal Open Market Committee raised the target range of the fed funds rate for the first time since 2006. This increase looks like a level shift in the index—a pattern that does not occur elsewhere in the sample. In particular, such a shift was notably absent around rate hikes during the Fed’s 2004–06 tightening cycle.

To have a discrete jump in the dispersion index coincide with a policy rate “liftoff” suggests a significant deterioration in pass‑through—a bad sign for the efficacy of monetary policy. What is behind this increase in dispersion? And why is the behavior of the index different in this tightening cycle than in the previous one?
What Drove the Post-Rate Hike Increase in Dispersion?
In short, the main culprit is an interest rate on certificates of deposit (CDs) used in the DK index. Despite an increase in the policy rate, this rate has remained flat through December 2015 and beyond.
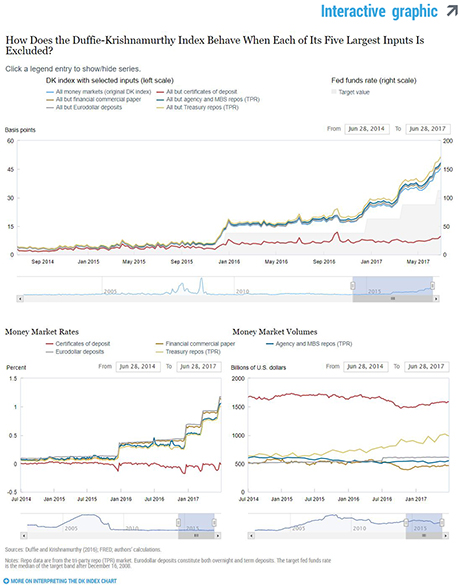
In the interactive chart shown below, the bottom left panel presents the rate series for the five money markets with the greatest weights in the index (which are based on outstanding amounts). CD rates (in red) did not respond to the December 2015 liftoff the way other rates did. As a result, CD rates deviated significantly from the average rate across markets, causing the measure of dispersion to increase. Moreover, since the index is weighted by volume and the CD market is roughly twice as large as the next largest market (as shown in the bottom right panel), the contribution of CD rates to the index is very large.
The effect of CD rates on the DK index is highlighted in the top panel, which shows the behavior, around liftoff, of different formulations of the DK index. The original is the light blue line; the red line is a version of the index that excludes CD rates.
Was the 2015 Rate Hike Really Different? Maybe Not
The jump in dispersion around the December 2015 liftoff stands out relative to the pattern seen during the Fed’s 2004–06 tightening cycle. This apparent anomaly turns out to be driven by an inconsistency in the data used for CD rates. In an effort to rely on publicly available data where possible, the DK index uses a secondary-market rate for CDs until mid-2013 (at which point the series was discontinued), then switches to a primary-market rate. While the former is representative of CD rates available to institutional investors, the latter is representative of CD rates available to retail investors. Extending the original data sample with non-public data and comparing such institutional and retail rates throughout the sample in the chart below, we see that retail CD rates also responded very slowly to the rate hikes that began in 2004 while institutional rates followed the hikes closely—consistent with the behavior during liftoff in 2015. This low sensitivity of retail deposit rates to increases in the policy rate has been documented in detail by Driscoll and Judson (2013).

Which Rate(s) to Include?
To compare the rate dispersion effect of the recent rate hikes to that seen during previous tightening episodes, we construct a dispersion index with a consistent series for CD rates. Given the striking difference between the behaviors of the two CD rate series, a key question is which rate or rates should be included in the index. This brings us back to the challenges of designing a measure of pass‑through efficiency. The chart below compares an index using an institutional CD rate throughout the sample to an index using a retail CD rate throughout the sample.

The two indexes have different implications for measured dispersion during tightening cycles. Using an institutional rate consistently shows lower effects of tightening on dispersion than using a retail rate. Based on their theoretical model, Duffie and Krishnamurthy view the deposit market as not very competitive—they assume that it is populated by “slow investors” for whom it is more costly to find the best available rate. In this framework, it seems preferable to use the more sluggish retail CD rate consistently throughout the sample.
An Almost Impossible Mission?
Our analysis highlights the challenges inherent in attempts to measure the efficiency of monetary policy pass‑through. But it also suggests that recent changes in money markets have not significantly impeded the pass‑through of monetary policy in the United States.
Disclaimer
The views expressed in this post are those of the authors and do not necessarily reflect the position of the Federal Reserve Bank of New York or the Federal Reserve System. Any errors or omissions are the responsibility of the authors.
 Gara Afonso is an officer in the Federal Reserve Bank of New York’s Research and Statistics Group.
 Adam Biesenbach is an analyst in the Bank’s Markets Group.

Thomas M. Eisenbach is a senior economist in the Bank’s Research and Statistics Group.
How to cite this blog post:
Gara Afonso, Adam Biesenbach, and Thomas M. Eisenbach, “Mission Almost Impossible: Developing a Simple Measure of Pass‑Through Efficiency,” Federal Reserve Bank of New York Liberty Street Economics (blog), November 6, 2017, http://libertystreeteconomics.newyorkfed.org/2017/11/mission-almost-impossible-developing-a-simple-measure-of-passthrough-efficiency.html.
 RSS Feed
 Follow Liberty Street Economics