Minimum equity capital requirements are a key part of bank regulation. But there is little agreement about the right way to measure regulatory capital. One of the key debates is the extent to which capital ratios should be based on current market values rather than historical “accrual” values of assets and liabilities. In a new research paper, we investigate the effects of a recent regulatory change that ties regulatory capital directly to the market value of the securities portfolio for some banks.
Securities Accounting and the “AOCI Filter”
Securities make up roughly one-quarter of banking system assets. These securities fall into one of three categories: “trading” assets, which are bought and held for the purpose of selling in the near term; debt securities that are intended to be “held to maturity;” or assets that are “available for sale,” an intermediate category.
From an accounting point of view, unrealized changes in the market value of available for sale (AFS) securities don’t affect a bank’s net income. However, they do affect the level of equity on the bank’s balance sheet. This is because the net difference between market and book value for these securities is tracked in a balance sheet item known as “accumulated other comprehensive income” (AOCI).
AOCI can be very sensitive to movements in asset prices, particularly bond yields, given that bank AFS portfolios are mainly comprised of fixed-income securities like mortgage backed securities (MBS), Treasury bonds, and municipal bonds. For example, rising interest rates in the first quarter of 2018 led to a $26 billion decline in AOCI for commercial banks, equivalent to nearly half the net income earned by commercial banks that quarter.
Reflecting this volatility, AOCI has not historically been counted when measuring regulatory capital for banks—a treatment known as the “AOCI filter.” However, as part of the implementation of Basel III in the United States, the AOCI filter has been removed for all large banks subject to the “Advanced Approaches” capital framework, as well as for any non-Advanced Approaches banks that elected to drop the filter. For these banks, the AOCI filter has been removed progressively over time. In 2014, 20 percent of AOCI was counted toward regulatory capital. This increased to 40 percent in 2015, and by another 20 percent each year thereafter until full phase-in of the new rule in 2018.
Bank Responses to Market-Value Based Capital Regulation
If banks are averse to volatility in regulatory capital, affected banking organizations are likely to take steps to mitigate the impact of the removal of the AOCI filter.
First, banks may reduce the risk in their securities portfolio (for example, by selling high-risk securities, or by hedging their risk exposure). Such de-risking would help reduce the volatility of a bank’s regulatory capital by making the value of its securities portfolio less sensitive to movements in the yield curve and other asset prices.
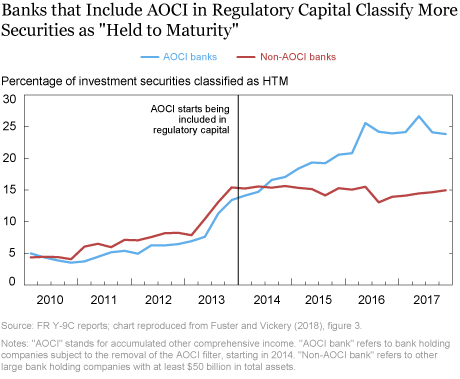
Second, banks may reclassify assets to “shield” themselves from the removal of the AOCI filter. In particular, they may classify more securities as “held to maturity” (HTM), since, unlike AFS, unrealized gains and losses on HTM securities do not flow through to AOCI or bank equity. Such reclassification would reduce the volatility of measured regulatory capital, even if it doesn’t reduce the fundamental risks of the securities in the bank’s portfolio.
We estimate the effects associated with the removal of the AOCI filter by comparing large banking organizations that are subject to the new rule with other large banks that are not. Our sample consists of forty-two bank holding companies (BHCs), of which nineteen are subject to the removal of the AOCI filter.
Our analysis is primarily based on quarterly security-level information submitted by BHCs in support of the Fed’s supervisory stress tests from 2011 to 2017. Crucially, these data allow us to study how portfolio risks have evolved even within a certain security class, such as Treasuries or agency mortgage backed securities (MBS), or how a particular bond is classified for accounting purposes at various banks. We supplement these security-level data with aggregate data on security holdings from BHC regulatory filings.
Effects on Risk-Taking
A large portion of the investment securities held by banks are agency MBS or U.S. Treasury securities. These securities are guaranteed (explicitly or implicitly) by the U.S. government, and thus have little credit risk. Instead, the key risk associated with these fixed income securities is “interest rate risk”—meaning the risk that rising market interest rates lowers the securities’ fair value. This risk is generally measured in terms of “duration”—higher duration means increased sensitivity to interest rate changes, and thus more risk.
We find little clear evidence that banking firms subject to the removal of the AOCI filter have responded by holding less risky (shorter duration) securities. For instance, the average duration of these BHCs’ MBS and Treasury portfolios did not fall significantly relative to those of other banking organizations, and the total risk exposure (measured as duration times the value of the exposure, relative to assets) has, if anything, tended to increase. We also find no evidence of a decline in the average book yield on investment securities among these banking firms.
We do find some evidence that the removal of the AOCI filter may have led BHCs to engage in additional hedging (through derivatives) of the risks underlying the securities. Hedging remains relatively modest overall, however.
Effects on Risk Shuffling
Since the start of 2014, when AOCI first started being included in regulatory capital, affected banking firms have classified a substantially larger share of securities as HTM, both in absolute terms and relative to other large BHCs that are not subject to the removal of the AOCI filter. In other words, banks began classifying securities differently so as to mitigate volatility in regulatory capital.

Could these trends be an artifact of differences in the types of securities held by different types of banks? Our analysis suggests the answer is no. Conducting statistical analysis using our granular security-level data, we find that the increasing tendency to classify bonds as HTM as the AOCI filter is removed holds even for a specific security (as identified by its “CUSIP”).
We estimate that the full removal of the AOCI filter induces a 15 percent increase in the likelihood of classifying a security as HTM for affected banks. This estimate is based on a statistical model which compares a given security held by different BHCs, and controls for time trends or fixed differences in classification across banks. Results are even stronger when we restrict the analysis to comparing the classification of the same bond held by different banks in the same quarter. We find that most of the effect comes from the way new securities being added to the portfolio are classified, rather than a reclassification of existing bonds from AFS to HTM.
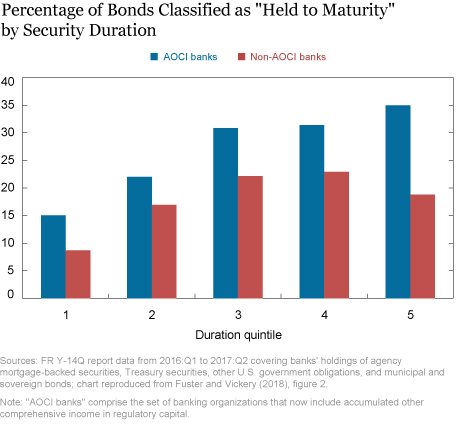
Notably, we find that the tendency to label more bonds as HTM is particularly strong for riskier (higher duration) securities. BHCs counting AOCI toward regulatory capital are more likely to classify bonds as HTM, regardless of the security’s duration (see chart below). But this effect is most pronounced for long-duration securities exposed to the largest amount of interest rate risk—in other words, the difference in height between the two bars in the figure is most pronounced for the quintile of securities with longest duration.

Bottom Line
Our results, as well as those of recent related research, suggest that banks are averse to volatility in regulatory capital, and have changed their accounting treatment of risky securities in order to mitigate this volatility. Notably, classifying securities as HTM makes them less liquid from a bank’s point of view, since that limits its ability to sell those securities in the future. This could limit banks’ options during a period of market stress or deleveraging. It could also reduce the overall secondary market liquidity for some bonds, given that banks are such important fixed-income investors.
Disclaimer
The views expressed in this post are those of the authors and do not necessarily reflect the position of the Federal Reserve Bank of New York or the Federal Reserve System. Any errors or omissions are the responsibility of the authors.
Andreas Fuster is an economic advisor in the financial stability department at the Swiss National Bank.
 James Vickery is an assistant vice president in the Federal Reserve Bank of New York’s Research and Statistics Group.
How to cite this blog post:
Andreas Fuster and James Vickery, “What Happens When Regulatory Capital Is Marked to Market?,” Federal Reserve Bank of New York Liberty Street Economics (blog), October 11, 2018, http://libertystreeteconomics.newyorkfed.org/2018/10/what-happens-when-regulatory-capital-is-marked-to-market.html.


 RSS Feed
 Follow Liberty Street Economics