One way to reduce the likelihood of bank failures is to require banks to hold more and better capital. But how much capital is enough? An international committee of regulators recently reached a new agreement (called Basel 3) to impose new, higher standards for capital on globally active banks. The Basel 3 common equity minimum capital requirement will be 4.5 percent plus an additional buffer of at least 2.5 percent of risk-weighted assets (RWA). Are these numbers big or small—and where did they come from? In this post, I describe how the new Basel capital standards were calibrated.
The Basel Committee on Banking Supervision recently announced an agreement to raise capital requirements for globally active banks. The Basel 3 capital standards include a new regulatory capital ratio—the tier 1 common capital ratio, which is based on a bank’s holdings of common equity relative to its RWA. Once Basel 3 has been fully implemented, globally active banks will be required to have a minimum tier 1 common ratio of 4.5 percent plus a buffer above the minimum equal to at least 2.5 percent of RWA. Banks whose tier 1 common ratios fall into the buffer zone will face increasing restrictions on their ability to pay dividends and make other capital distributions to their shareholders. (The Basel Committee’s report explains the new capital requirements in detail.)
These new standards represent a significant increase in regulatory capital requirements. But how did the Basel Committee decide what the minimum capital requirement and buffer should be? Where did the numbers come from? The Committee considered a range of analyses, including an examination of the long-run costs and benefits of higher capital requirements, an assessment of the near-term transition costs, and an examination of the impact of the proposed rules on individual banks. The Committee also considered a “top-down” calibration exercise that used historical data on earnings, revenues, losses, and capital for individual banks from more than a dozen countries.
The first step in this top-down calibration work was to define what the different regulatory capital ratios were meant to achieve. For instance, what should we think about a bank operating right around the regulatory minimum? There are many possible ways to answer this question, each with its own set of implications for the banks and for the actions supervisors might want to take. The answer in this case recognized the two-part nature of the new regulatory capital requirements—a regulatory minimum requirement topped by a capital conservation buffer. In particular, the calibration work was based on the idea of the regulatory minimum capital level as the amount of capital needed for a banking company to be regarded as a viable going concern by creditors and counterparties, while the capital conservation buffer is an amount sufficient for a bank to withstand a stressful period and still have capital above the regulatory minimum.
The recent financial crisis, along with historical ones, has provided ample data to help calibrate the capital conservation buffer, since we can see relatively directly how banks’ capital positions were affected in these periods of severe stress. However, the definition of the regulatory minimum ratio is much more abstract, so a more inferential strategy was needed to operationalize it. The approach taken was to examine the distribution of historical losses in the banking industry, under the assumption that a high-percentile net loss realization (negative net income) for banks is a good approximation of the market’s view of going-concern capital sufficiency in an ex ante, unconditional way. This seems an appropriate benchmark for a regulatory capital minimum that applies across all banks for all points in time, even though it might not reflect market expectations in all situations.
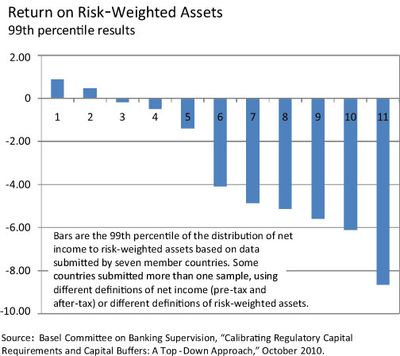
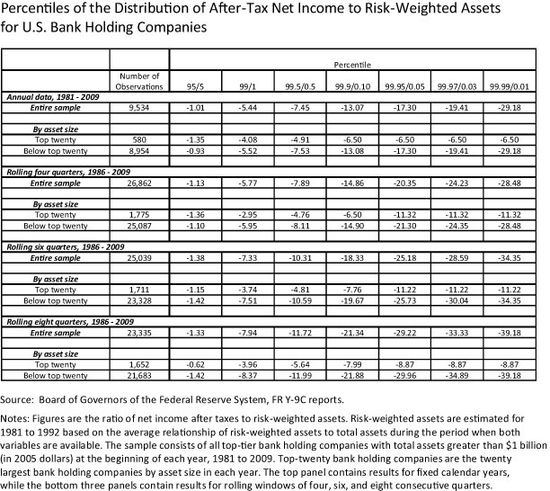
The analysis considered by the Basel Committee used historical data from seven countries. There were significant differences in the number of banks, length of historical time period, and, in some cases, variable definitions (for instance, pre-tax or after-tax earnings) in the data from the different countries that complicated interpretation of the results. Nevertheless, the data provided some important insights into the scale of losses experienced historically by banks in different countries. The chart below—taken from the Basel Committee’s report—shows results across the seven countries. The bars show the 99th percentile of the income distribution for each country, where annual income is scaled by RWA. This ratio is called “return on risk-weighted assets” in the report, drawing on work by Andrew Kuritzkes and Til Schuermann, who first suggested calibrating capital requirements using this approach. The table shows the same calculations for U.S. bank holding companies, looking at different holding periods (that is, the period over which income is measured), samples of banks, and percentiles.
The analysis focuses on the left-hand (negative net income) “tail” of the distribution. This part of the distribution contains the largest losses relative to RWA, and thus is most relevant for capital calibration purposes. The chart presents results for the 99th percentile, but the analysis examined a range of percentiles and a range of holding periods since it is difficult to know precisely what assessment market participants might make when judging a banking company’s viability. Considering a range of results provides a more robust calibration than examining a single set of parameters.
There are some reasons to treat these numbers as lower bounds of the true extent of losses reflected in the high tails of the earnings distribution. First, if a banking company were to fail, its last quarters of (presumably) very large losses might not be captured in the data. Further, any losses avoided by official sector actions such as guarantees, loss-sharing arrangements, or resolution funds would not be reflected in these data.
What do the numbers imply for the calibration of the regulatory minimum capital level? The 99th percentile results range between positive 1 percent and more than negative 8 percent. The median value across all countries is about -4 percent, while the median excluding the positive observations is about -5 percent. One important factor to note is that the RWA in the denominator of these figures is calculated under a different set of rules than those that will prevail when the new capital regulations come into effect. The general belief is that RWA for a given set of positions will tend to be higher under the new Basel 3 regime. If we take this translation effect into account, these figures suggest that the 4.5 percent regulatory minimum requirement adopted by the Basel Committee for the tier 1 common ratio is consistent with a high-percentile coverage of realized negative net income outcomes actually experienced by banks during recent history.
Disclaimer
The views expressed in this post are those of the author(s) and do not necessarily reflect the position of the Federal Reserve Bank of New York or the Federal Reserve System. Any errors or omissions are the responsibility of the author(s).


 RSS Feed
 Follow Liberty Street Economics