Commodity prices have risen considerably since August 2010, raising concerns that higher commodity prices could reduce households’ discretionary income and slow the recovery. For example, as former Federal Reserve Board Vice Chairman Donald Kohn said in the Wall Street Journal last fall:
“… the surge in international commodity prices. If that persists it could hurt Americans’ disposable income, especially as it is reflected in higher gas and energy prices.”
Is that concern warranted? Because food and energy are an important part of most household budgets, there is certainly the potential for a large impact from commodity price increases, and undoubtedly many household budgets have been impacted adversely by the recent commodity price increases. Still, my analysis in this post finds that the effect of commodity price swings on aggregate household discretionary income generally has been more modest than other influences, such as the 2011 temporary payroll tax reduction.
I concentrate on the two areas of personal consumption expenditures (PCE) that are most directly exposed to commodity prices: food purchased for off-premises consumption (“food”) and energy. There are then two important components in measuring the discretionary income effect: the share of these goods in total PCE and the relative prices of these goods.
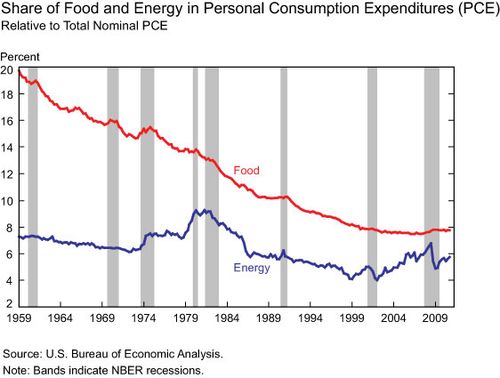
In terms of expenditure shares, the chart below shows that the share of food expenditures fell from nearly 20 percent in 1959 to slightly less than 8 percent in the early 2000s, which is about the current food expenditure share. Energy has shown somewhat greater volatility, but its current share of about 5¾ percent is still notably below its share in the 1960s and 1970s.
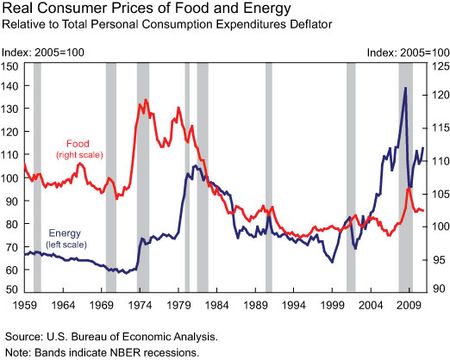
As shown in the next chart, real consumer food prices (based on the PCE deflator) over recent years have remained below the levels seen prior to the mid-1980s, even after the food commodity price spike in 2008. In contrast, real energy prices have displayed considerably greater volatility (note that the energy scale is much wider), and have been above the levels seen after the oil price shocks of the 1970s, especially after the price spike in 2008.
To use these two components to measure the discretionary income effects, I apply a method discussed in a recent paper by Edelstein and Kilian (restricted) to construct “purchasing power changes” associated with energy and food price changes. The intuition behind the method is measuring the additional income needed to maintain a previous period’s share of food and energy expenditures given the change in real prices for those goods in the current period. Because this method explicitly does not allow for substitution, we can think of these calculations as providing an upper bound for the discretionary income effect.
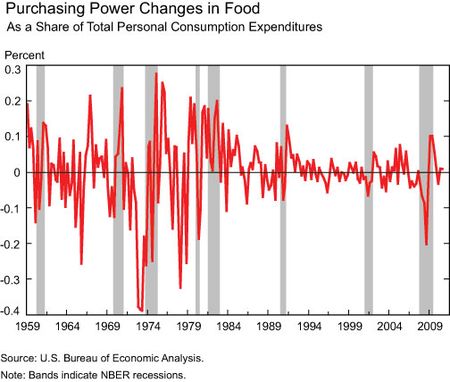
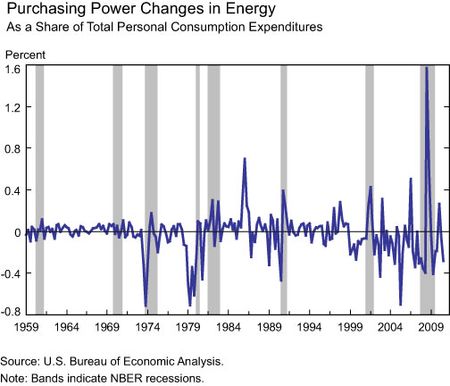
The next two charts display the calculated purchasing power changes for food and energy. For food, these magnitudes have been quite small since the mid-1980s. Even in the case of the food price rise in 2008, the largest decline in purchasing power was less than 0.2 percent of PCE—in dollar terms, 0.1 percent of current PCE is roughly $10 billion at an annual rate. Befitting the greater volatility of energy prices, purchasing power changes for energy have been larger.
However, even in the case of energy, these purchasing power changes generally appear to be small relative to tax changes: for example, the two percentage point reduction in the payroll tax that is part of the recently enacted fiscal agreement is estimated to raise disposable income for 2011 by about $120 billion.
To assess the effects of commodity prices on total consumption, I estimate a small, three-variable vector autoregression (VAR) model consisting of the percentage change in real oil prices, purchasing power changes for energy, and the percentage change in real PCE. (A similar VAR is estimated for food.) The estimated instantaneous elasticity of oil prices on real PCE—that is, the percentage response of real PCE to a 1 percent increase in oil prices—from the model is near zero, and the longer term elasticity is near -0.05 (for food, the longer term elasticity is near -0.1). In each case, the variance decompositions, which calculate the portion of the model’s forecast variance attributable to “shocks” of each variable, indicate that commodity prices and purchasing power changes have a relatively modest role in PCE fluctuations (10 to 15 percent at horizons of one year or more).
Overall, it appears that the discretionary income effects of commodity price changes generally have been a fairly small factor in aggregate consumption fluctuations. However, there are two issues that are beyond the scope of my analysis. First, as discussed in a recent Economic Trends article by the Cleveland Fed, many households, especially low-income ones, spend a larger share of income and expenditures on food and energy than indicated in the macroeconomic data. Consequently, they are more susceptible to price increases in these goods. I plan to discuss this issue further in a future post.
Second, the discussion in this post assumes that the effects are linear. As Jim Hamilton has documented in many pieces (a recent example is his 2009 paper), oil prices appear to have a nonlinear effect on GDP—in particular, oil price increases that raise prices above recent peaks are associated with GDP declines, but oil price decreases and small increases appear to have little effect. If such effects are also true for consumption, then large commodity price increases potentially could have a larger effect on consumption than suggested here. Examining the possible nonlinear effects on consumptio
n will have to be the subject of another future post.
Disclaimer
The views expressed in this blog are those of the author(s) and do not necessarily reflect the position of the Federal Reserve Bank of New York or the Federal Reserve System. Any errors or omissions are the responsibility of the author(s).


 RSS Feed
 Follow Liberty Street Economics
I want to thank the readers for their comments. Regarding the question in one comment about food and energy expenditures as a percentage of GDP less gross savings, it turns out those percentages display similar patterns over time as food and energy expenditures as a percentage of PCE, so that probably would not help out in accounting for the effects of a skewed income distribution. More generally, the comments reflect some limitations of my analysis using aggregate data. Because food and energy shares can differ across households, in particular across the income distribution, the overall impact of commodity prices on discretionary income and consumption potentially could differ from the conclusions using aggregate data only. As mentioned in my original post, I am working on some analysis that addresses the issues of differential expenditure shares of food and energy across the income distribution that I plan to discuss in a future post.
There are a couple of additional issues that I failed to mention in the original post. First, the analysis uses quarterly averages of commodity prices, but some additional analysis using monthly data leads to similar conclusions. Second, the analysis depends upon average historical patterns holding in the current environment of large rapid increases in commodity prices. The possibility that this may not be true represents a notable risk to any projection based on my analysis.
Personally, food prices in my area of the country (Arizona) have increased substantially (10% or more in the past year). My personal discretionary income has remained static. This means that I am, personnally, less well off today then last year at this time. I sense that this situation is typical of most wage earners and fixed income people in Arizona.
I’m struggling with the math here. If the income distribution is very skewed, then the mean spending on food and energy won’t tell us much about the effect of changes in those relative prices. Those price changes will have practically zero effect on the consumers whose income makes up the bulk of the national income accounts, but a large effect on the bulk of consumers. Shouldn’t we be looking at food and energy spending as a percentage of (GDP less gross savings) as a means of adjusting for the income skew?