Richard Peach, Josiah Bethards,* and Joseph Song**
What will the unemployment rate be in 2013? Even if you were certain how much the U.S. economy (gross domestic product, or GDP) would grow over the next year or two, it would still be difficult to forecast the unemployment rate over that period. The link between GDP growth and unemployment is complex in part because it depends on how many people decide to work or look for work—that is, the labor force participation rate. In this post, we discuss the recent steep decline in the labor force participation rate and explain how uncertainty regarding the future path of that variable contributes to conflicting views about the future path of the unemployment rate.
Although many other variables involved in the translation of GDP growth forecasts into unemployment rate forecasts (such as productivity and population growth) receive a great deal of attention from economists, the one that has been written about a lot recently is the labor force participation rate. (See, for example, Congressional Budget Office projections.) The labor force participation rate is defined as the percentage of the civilian noninstitutional population aged 16 and over that is in the labor force, meaning that they are either working or actively looking for work. Changes in this variable over time reflect numerous demographic, economic, and behavioral forces. For example, the participation rate rose steadily from the mid-1960s through the mid-1990s. This reflected well above average growth for the population in the 25-to-54 age range, for which participation rates are well above average, as well as significant increases in labor force participation by women of all ages. Working in the opposite direction was a decline in the labor force participation rate of men, particularly older men.
The Participation Rate over the Recent Business Cycle
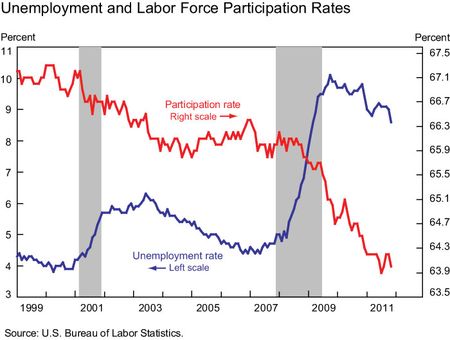
What has happened to the labor force participation rate over the recent business cycle? The chart below presents the official unemployment rate and labor force participation rate published by the Bureau of Labor Statistics (BLS). Note that from the most recent business cycle peak in fourth-quarter 2007, the labor force participation rate has fallen sharply, from 65.9 to an average of 64.2 over the first half of 2011. Note also, however, that the participation rate has been on a downward trend for most of the past decade. The question that comes immediately to mind when looking at this chart is where the current level of the participation rate is relative to the trend of the past decade.
What Is the Underlying Trend?
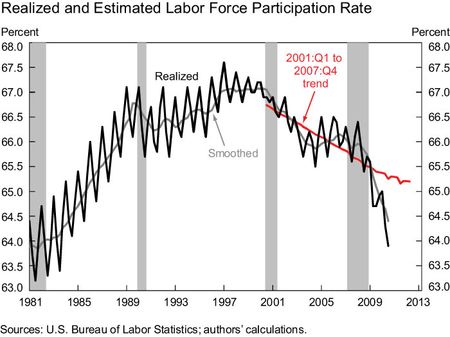
To estimate the trend of the labor force participation rate over the past decade, we divide the labor force into groups based on age (16 to 24, 25 to 34, 35 to 44, 45 to 54, and 55+) and sex and then estimate the trend of the participation rate for each of these groups for the period first-quarter 2001 to fourth-quarter 2007—business cycle peak to business cycle peak. We then extend those trends beyond fourth-quarter 2007 by applying the trend participation rates to actual and projected population counts for those age and sex groups to derive an aggregate trend participation rate.
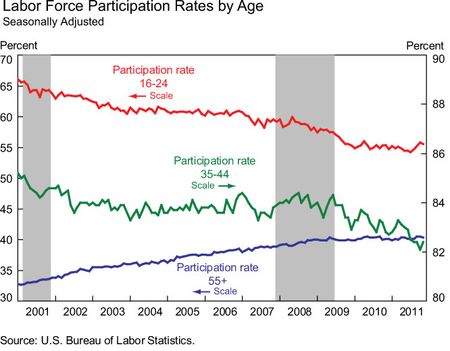
It is interesting to note that, in addition to different levels, different age and sex groups have quite different trends. For example, as shown in the chart below, the participation rate for persons aged 16 to 24 was trending downward over the past decade, the rate for those aged 35 to 44 was relatively stable, while of the rate for persons aged 55 and older was trending upward. The downward trend of the aggregate participation rate over the past decade has been driven mainly by demographic factors. The fastest growing population groups, those in the 20-to-24 and 55-and-older groups, have relatively low participation rates. In contrast, people in the 35-to-44 age group have relatively high participation rates, yet their absolute numbers have been declining.
The next chart presents this estimated aggregate trend participation rate and compares it with the actual rate. As of second-quarter 2011, the actual rate was roughly a full percentage point below this trend. At this point, it is not clear whether this is strictly the result of the weakness of the labor market or whether the trends established over the past decade have begun to change.
Which Demographic Groups Account for the Decline Below Trend?
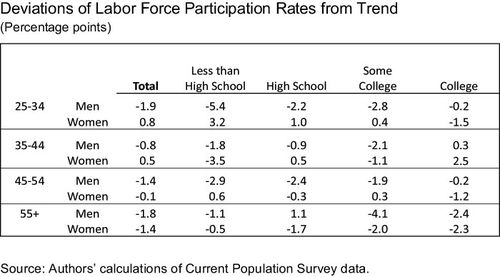
The chart below presents the percentage point deviation from trend by age, sex, and education attainment. The first observation is that the labor force participation of men of all ages at all levels of education attainment has declined considerably more than that of women. A possible explanation of this phenomenon is that industries in which men have above average representation, such as construction, have experienced particularly large declines of output over the past several years, whereas industries in which women have above average representation, such as education and healthcare, continued to expand even during the recession. A second observation is that the participation rates of older workers, even those with college educations, have tended to decline more than that of younger workers. In this case, several factors are likely at work, ranging from early retirement packages, lack of job opportunities for given skill and/or salary levels, and possibly age discrimination by some employers.
Implications for Unemployment Rate Projections
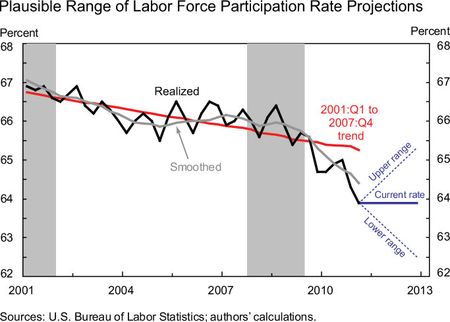
No one knows for certain what path the participation rate will take over the next twelve to twenty-four months. Will it revert back to the trend of the past decade discussed above? Will it remain at the level of the first half of 2011? Or has the decline of the past two years established a new trend? While completely hypothetical, the chart below provides a visualization of the range of outcomes that these three potential paths imply. By the end of 2013, the range approaches a full three percentage points. All else equal, that is the range of potential outcomes for the unemployment rate.
Conclusion
The labor force participation rate has fallen sharply since the previous business cycle peak in fourth-quarter 2007. The decline has been more pronounced than one would have predicted based on the trends of the past decade, such that the participation rate is roughly a full percentage point lower than its underlying trend. Forecasts of the U.S. economy for the next several years that are quite similar in most other respects could have quite different paths for the unemployment rate depending on the assumptions made for the labor force participation rate over the forecast horizon. Moreover, a declining unemployment rate does not necessarily imply that the labor market is tightening if it is due to a decline of the labor force participation rate.
Related Questions:
- Who produces the official statistics on unemployment and labor force participation and how are they derived? The official unemployment rate and labor force participation rate for the U.S. economy are published monthly by the Bureau of Labor Statistics of the U.S. Department of Labor. They are based on a monthly sample of U.S. households—the Current Population Survey—conducted by the Bureau of the Census of the U.S. Department of Commerce.
- Are there measures of labor underutilization which reflect the fact that people may have dropped out of the labor force in addition to the official definition of unemployment? Yes, the BLS regularly publishes alternative measures of labor underutilization. The so-called U-4, U-5, and U-6 measures progressively include discouraged workers, persons marginally attached to the labor force, and persons working part-time for economic reasons, as being unemployed.
* Josiah Bethards is an analyst in the Federal Reserve Bank of New York’s Office of Financial Stability and Regulatory Policy.
**Joseph Song is a former assistant economist in the Federal Reserve Bank of New York’s Research and Statistics Group.
Disclaimer
The views expressed in this blog are those of the authors and do not necessarily reflect the position of the Federal Reserve Bank of New York, or the Federal Reserve System. Any errors or omissions are the responsibility of the authors.


 RSS Feed
 Follow Liberty Street Economics
Predictions about the employment rate is always difficult. The future will show us how it goes.
Didn’t the participation rate also hit new lows during the 1970-mid 1990 period until we had welfare reform? For the last ten years, welfare has come storming back even easier than in the past. Only now it’s done by completing tax returns. With the IRS it’s virtually no verification. We need to stop rewarding winners and losers in the personal and corporate world via the tax code and flaten it out. You get baby sitting credits, ‘earned’ income credits,stimulus credits, etc. Small wonder fewer people are bothering to look for work. Has anyone audited the BLS and Commerce Census staff, methodology and reports to ensure the integrity of the data? Once upon a time it was felt to have been politicized. Perhaps that time has returned. If I were in charge at those bureaus, I would ask for audits to ensure the integrity of the results.