Jonathan McCarthy, Simon M. Potter, and Ayşegül Şahin
A major theme of the posts in our labor market series has been that the outflows from unemployment, either into employment or out of the labor force, have been the primary determinant of unemployment rate dynamics in long expansions. The key to the importance of outflows is that within long expansions there have not been adverse shocks that lead to a burst of job losses. To illustrate the power of this mechanism, we presented simulations in a previous post that were based on the movements in the outflow and inflow rates in the previous three expansions. These simulated paths show the unemployment rate declining to a level well below current consensus predictions over the medium term.
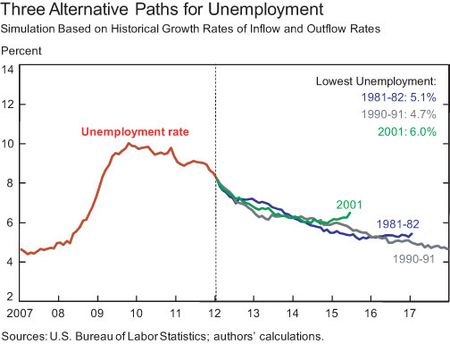
In this post, we run these simulations to their natural conclusion to see what happens to the unemployment rate if the current expansion lasts as long as any of the three most recent expansions. Recall that in these simulations, we assume that the inflow and outflow rates change at the same pace as they did in the expansions following the 1981-82, 1990-91, and 2001 recessions starting at thirty months into the expansion (roughly the point where we are now in the current expansion) through the start of the next recession (see the Okun’s Law post in this series for the length of each expansion). The simulated unemployment paths based on the three different scenarios are shown in the chart below.
The simulations demonstrate the importance of expansion length in reducing unemployment. Under the flow dynamics of the record-long 1990s expansion, the simulated unemployment rate falls to 4.7 percent, 5.3 percentage points below the peak unemployment rate observed in the recession period. For comparison, the actual unemployment rate fell to 3.9 percent in the 1990s expansion, 3.9 percentage points below its peak. The simulation using the flow rates in the 1980s expansion gives very similar dynamics: the simulated decline is 4.9 percentage points, whereas the unemployment rate actually fell 5.8 percentage points in the 1980s expansion to 5 percent. Consistent with the shorter duration of the 2000s expansion, the simulation based on the flow rates from that expansion has a minimum unemployment rate of 6 percent and the unemployment rate begins to rise toward the end of the simulation.
Prospects for Flow Rates: What Do They Imply?
The importance of the outflow rate in unemployment rate dynamics during long expansions prior to the 2000s was virtually assured. In those periods, the rate of inflow to unemployment from nonparticipation was mainly driven by long-term trends, particularly the entrance of married women into the labor force (see the labor force participation post in this series). In most expansions, there have been temporary surges in the flow from nonparticipation to unemployment as job market prospects brighten. This was the case in February of this year, when the unemployment rate didn’t decline despite strong growth in employment because many prospective workers moved from being out of the labor force into unemployment.
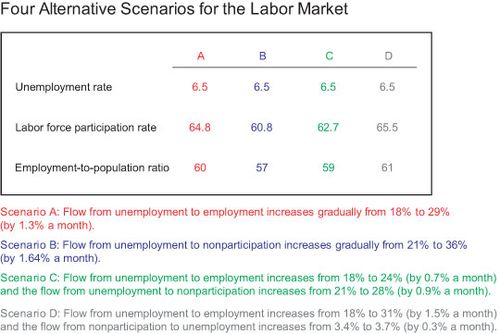
To illustrate the impact of labor flows and labor force participation decisions on labor market conditions, we undertake another simulation exercise consisting of four scenarios. In each scenario, the assumptions are such that the unemployment rate falls to 6.5 percent at the end of 2014—below the Blue Chip consensus forecasts of the average annual rate in 2014 and 2015 of 7.2 and 6.7 percent, respectively. What differs across the scenarios is the combination of flows assumed in order to arrive at that unemployment rate.
In scenario A, we assume that the job finding rate increases over the period to near pre-Great Recession levels. With the unemployed finding jobs more easily, both the labor force participation rate and the employment-to-population ratio rise, although they remain below their levels prior to the recession. Still, an increase in the job finding rate to a near “normal” rate by itself would lead to notable improvement in unemployment and other measures of labor market conditions.
In scenario B, we assume that the flow from unemployment to nonparticipation increases to somewhat above pre-Great Recession levels. Here, although the unemployment rate is “improved,” the labor force participation rate is more than 3 percentage points below the February 2012 level and the employment-to-population ratio is back to its 1977 level. To us, this pattern does not represent any true improvement in labor market conditions.
Typically, as an expansion matures, we observe increases in both the job finding rate and the unemployment to nonparticipation rate. We assume such a pattern in scenario C. Labor force participation declines moderately with the greater flow into nonparticipation, but the employment-to-population ratio is little changed from the February level.
In scenario D, we assume increases in the job finding rate and the flow from nonparticipation into unemployment, as formerly discouraged workers re-enter the labor force. Because of the increase in the latter flow, the job finding rate in this scenario has to be modestly higher than in the first scenario for unemployment to fall to 6.5 percent. Still, the additional flows into unemployment move relatively quickly into employment. Consequently, the employment-to-population ratio rises more in this scenario than in any of the other ones.
Next, we provide an overview of the current state of the four main flow rates that determine the unemployment rate.
Outflow Rate
The outflow rate from unemployment has two components—job finding (into employment) and labor market exit (into nonparticipation).
Job Finding Rate
A crucial determinant of this rate is the number of job openings relative to the number of unemployed workers. Currently there are 0.25 vacancies per unemployed worker as opposed to the pre-recession level of 0.70. This ratio is likely to improve as more jobs are created and more workers find jobs. Moreover, matching workers with jobs should become easier as flows between occupations bring vacancies and skills into better alignment (see our earlier post). Data on job openings from the Bureau of Labor Statistics’ Job Openings and Labor Turnover Survey (JOLTS) and measures of mismatch based on the Conference Board’s Help Wanted OnLine (HWOL) database (see Şahin, Song, Topa, and Violante [2011] for examples) will provide information on whether this improvement is occurring, and we will monitor developments in a post this summer.
An important related issue is the current high level of long-term (more than six months) unemployed workers and their employment prospects. According to Elsby, Hobijn, Sahin, and Valletta (2012), about 11 percent (on average) of the long-term unemployed find a job each month: this implies that half of the long-term unemployed will find jobs within six months. Moreover, the job finding probability of the long-term unemployed has behaved similarly to that of the short-term unemployed, as was noted in a recent speech by Fed Chairman Ben Bernanke. Of course, it would be better if job finding improved such that workers did not become long-term unemployed, but the job finding rates of the long-term unemployed appear sufficient to make it likely that improved prospects for the short-term unemployed would lead to a rapid recovery in labor market conditions.
Labor Market Exit Rate
The other component of the outflow rate is labor market exit. Since 2009, labor market exit has been a more likely outcome for unemployed workers than finding a job. One factor that may underlie some of the increase in labor market exit is the exhaustion of unemployment insurance benefits (see Hu and Schechter). As more unemployed workers face an expiration of benefits, labor market exit is likely to increase in the near term.
A long-term trend influencing labor market exit is the aging of the baby-boom generation. Many people of this generation might respond to job loss or extended unemployment spells by leaving the labor force through retirement.
Another issue that will affect the labor market exit rate is the behavior of married women. As we discussed in an earlier post, married women could exit the labor force as their spouses find jobs or if the spouse’s earnings rise.
Inflow Rate
The inflow rate to unemployment has two components: inflows from employment (job loss) and the flow from nonparticipation to unemployment (labor market entry/re-entry).
Job Loss
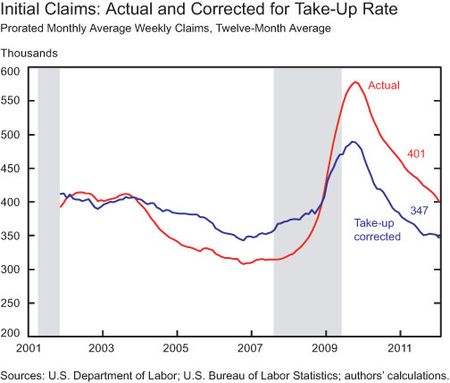
Job losses subsided substantially after 2009. One useful measure to track job loss is the four-week moving average of initial claims for unemployment insurance. Even though it increased somewhat in mid-2011 when the labor market showed strains, it has dropped substantially from more than 650,000 in March 2009 to about 365,000 currently. If we take into account the level of employment and the take-up rate of unemployment benefits (when the labor market is weak more eligible job losers apply for unemployment benefits), this measure of job loss is relatively low, as the chart below indicates. (For the take-up adjustment of claims, see Hobijn and Sahin). These data suggest that if the expansion continues, then inflows from job loss are likely to be lower than during the 2000s expansion.
Labor Market Entry/Re-entry
Flows from nonparticipation into unemployment remain elevated and continue to contribute to unemployment. One source of labor market entry is new entrants. It is likely that new entrants (for example, recent college graduates) have had difficulty finding jobs in the weakened labor market and thus initially join the labor force as unemployed workers. As labor market conditions improve, more graduates will find work without going through a spell of unemployment—a development that is likely to reduce this flow.
Labor market re-entry is another source of unemployment inflows. Some of the current unemployment inflows are driven by individuals who had stopped looking for work for some months and then started looking again (Elsby, Hobijn, Sahin, and Valletta). The number of such marginally attached workers is difficult to measure accurately and, as noted above, could offset some of the usual dominance of the outflow rate in long expansions. Two measures of such workers are readily available. One is discouraged workers, nonparticipants who cite labor market conditions as the reason they have not looked for work in the last four weeks; this group is currently estimated to number around one million. The second is the total estimate of marginally attached workers, which is almost three million currently. Both estimates rely on the marginally attached person having looked for work at some point in the last twelve months; given the sluggish recovery, these measures may underestimate the true stock of marginally attached workers. Still, if all of the workers included in these measures were counted in the labor force, then the participation rate would be about 65 percent rather than 64 percent. Depending on assumptions about the retirement behavior of baby boomers, this rate is either close to the trend participation rate as estimated by the Congressional Budget Office and the Social Security Administration or below it.
Conclusion
This series of labor market posts has examined the possible paths of the unemployment rate if the current expansion lasts beyond the postwar average of fifty-nine months. Of course, readers of this post may consider the assumption that the current expansion will last at least until mid-2014 as optimistic. However, once one assumes an ongoing expansion, then it seems likely that the unemployment rate will continue to fall more quickly than predicted by consensus forecasts based on a moderate growth outlook. Whether or not this fall in the unemployment rate produces fast overall growth in the economy depends on the speed at which the employment-to-population ratio increases and the productivity of the workers added as the labor market expands. The flow-based approach we have taken to study the labor market appears superior to the more aggregate approach taken by many forecasters using Okun’s Law. Moreover, even though flow rates have declined in recent years, the U.S. labor market remains dynamic by international standards. By examining flows as well as stocks in the labor market, we come to conclusions that differ from the conventional wisdom about how difficult it might be to reduce so-called structural unemployment, as we showed in our analysis of unemployed construction workers.
Disclaimer
The views expressed in this blog are those of the authors and do not necessarily reflect the position of the Federal Reserve Bank of New York or the Federal Reserve System. Any errors or omissions are the responsibility of the authors.


 RSS Feed
 Follow Liberty Street Economics
I looked at the Labor force participation rate as calculated by BLS. Since 1990 it has not fallen before 65.9 (even in recession of 2003). It dropped by .5% in 1990 and from 1970s it was growing from 60s and even in the peak of the recession, the labor force participation was growing. However since 2007 the drop has been much steeper. Now it is almost 63.9 and drop has been almost 3%. Quite a steep drop. I would think people are really dejected to leave the labor force. The women, who were working I would think would want to come back to work, so many people cannot be retiring for good. In the past 20 years the participation has been close to 66, demographics of the society cannot change in 2-3 years. So I am actually quite perplexed, as who these 2-3% of the people are If we know who these are many be something can be done, don’t know what. Goal should not be just to reduce the unemployment number, as your article rightly said it is a combination of inflows and outflows. I also think about the new entrants every month of 3 MM people, implying that people leave and come back, when they are depressed and come back when they have a hope. Don’t know whether these are long term out of work or just temporary. Some kind of research on long term unemployed can help in devising proper credit policy for housing. Whether the foreclosure is due to continous unemployment or there is short term unemployment. Keep blogging. I have been following them closely.
Not sure the conclusion is a good thing or a bad thing. I have followed the whole series with lot of interest. Basically you are presuming the recovery will be similar to the previous three recessions and unemployment will go down either in a good way (people finding jobs) or bad way (people getting discourage). Implicit assumption that recovery will be like past 3 recessions may not be a good assumption to begin with. Let us presume you are in a county where there is no new company and all the jobs were gone due to the existing company becoming bankrupt. Now if there are no jobs, then people are not likely to find jobs. So people will go to non participation rate and unemployment will go down as people are not looking for jobs. Is this a good thing. There is something to be said for the value of the analysis.