James J. McAndrews, Donald P. Morgan, and James Vickery
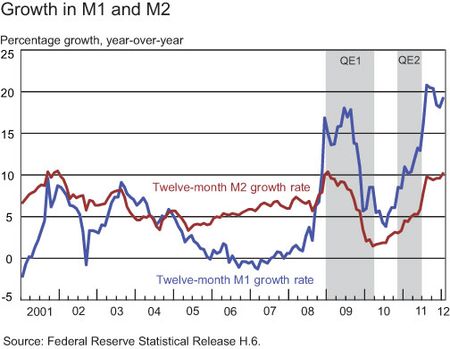
Two key monetary aggregates, M1 and M2, have grown quickly recently—especially M1, the narrow aggregate. In this post, we show that we can attribute most, but not all, of the recent high money growth rate of M1 to low current interest rates as well as the growth in bank reserves that has resulted from the Fed’s asset purchase programs. It’s unlikely that the current high growth rate will continue in the long term, however, as both low interest rates and the Fed’s expansion of bank reserves will likely be reversed as economic growth accelerates.
M1 Is Growing Rapidly; M2 Not So Much
The chart below shows that the annual M1 growth rate is around 20 percent, which is very high by recent historical standards. M1 includes currency in circulation, demand deposits, and other checkable deposits. M2 growth has also increased significantly since 2010, but is still within its recent historical range. M2 includes M1 plus savings deposits, retail time deposits, retail money funds, and some other categories. Notice that M1 and M2 growth increased during the periods in which the Federal Reserve expanded its balance sheet through large-scale purchases of Treasuries and other securities, the so-called Quantitative Easing—“QE1” from 2009 to early 2010 and “QE2” from late 2010 to mid-2011—although M1 responded more rapidly in percentage terms during these periods.
Is It All about Reserves?
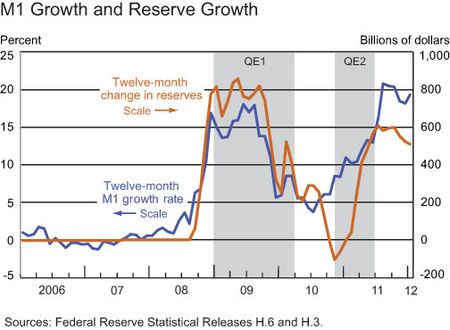
The chart below shows that M1 growth is highly positively correlated with the growth in reserves generated by Fed asset purchases. The reason for this is simple: Reserves held with the central bank are assets for banks. As the Fed expands reserves, banks must either sell other assets (keeping the overall level of assets unchanged), issue more liabilities or equity (expanding the level of assets), or some combination of the two. In fact, banks did not reduce their overall holdings of other assets as reserves increased. Instead, banks mainly funded these new assets by issuing additional liabilities, including deposits. Over the same period, interest rates were low, reducing the incentive for households to place their funds in interest-earning savings accounts rather than checking accounts. Correspondingly, much of this increase in bank liabilities has been in the form of checkable deposits. This helps explain why M1 has grown more than M2.
What about Loans?
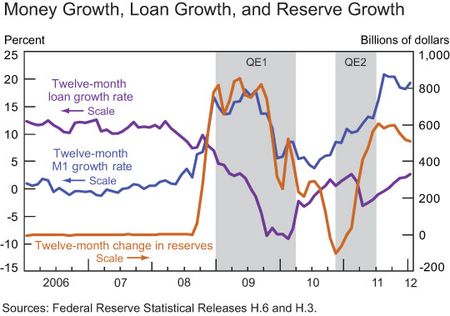
Another possible explanation for the high money growth is that banks are lending more and funding the additional loans by issuing deposits. To check this possibility, we add loan growth to the previous chart. In fact, it does appear that loan growth may have had some influence in the more recent period of high growth in M1—the period starting in mid-2010.
Bringing It All Together
To investigate these and other possible influences simultaneously, we estimated a simple statistical model of M1 and M2 growth as a function of the following variables:
- Growth in bank reserve balances (in billions of dollars). As just explained, more reserves are expected to lead to growth in deposits because commercial banks must issue additional liabilities or equity to “fund” any increases in their asset holdings due to higher reserves.
- Short-term interest rates (the one-year Treasury yield). Low interest rates, especially a zero interest rate, make noninterest balances relatively more attractive by reducing the interest rate penalty associated with holding money balances. This effect is consistent with a traditional money demand equation.
- Nominal GDP growth (in percent). Transaction demand for money depends on nominal expenditures, output, or both—again consistent with a traditional money demand equation.
- Loan growth (in percent). More lending by banks, much like higher reserves held by banks, requires banks to attract deposits or other liabilities to fund the loans.
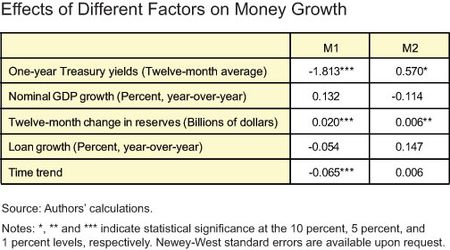
All these data are available at a monthly frequency, except for nominal GDP, which we interpolate from its quarterly frequency. We estimated regression models of both the monthly and annual money growth rate. Results from the regression that uses overlapping year-on-year growth rates (which are estimated using data from 1983 onward) are shown here.
The results are informative. Notice first that a decline in one-year Treasury yields tends to boost M1 growth, as we noted at the outset. This effect is consistent with the overall trend we’ve seen in the last few years. There is no evidence that lower interest rates increase M2 growth; however, if anything, the results suggest (perhaps puzzlingly) that the opposite is true, although the statistical significance of the result is relatively weak. In addition, reserve growth consistently increases money growth, but has a larger effect on M1 than on M2. Curiously, neither nominal GDP growth nor loan growth is statistically significant in either model.
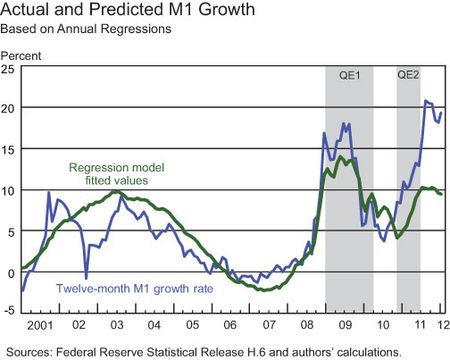
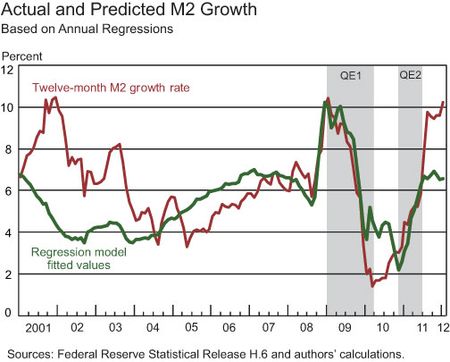
To get a better sense of the accuracy of the models, the charts below plot actual and predicted money growth. The regression models do a good job of accounting for M1 and M2 growth in general, although they can’t explain the continued growth in the aggregates since the end of QE2. We invite readers to suggest reasons for our model’s “miss” here.
Overall, however, what this analysis tells us is that recent growth in M1 and M2, particularly the former, is explained primarily by the Fed’s expansion of reserve balances. M1 growth is especially elevated due to the low interest rates of recent years.
Heading for the Exit
What does this explanation portend for future growth in M1 and M2? The Fed’s exit strategy (from the expanded balance sheet generated by responses to the financial crisis) should slow growth in these monetary aggregates. First, the Fed could stop reinvesting some or all of the payments of principal on the assets it acquired in “QE1” and “QE2.” That action would drain reserves from the banking system. The Fed has also devised temporary draining tools (reverse repos and term deposits) that would, as their name suggests, temporarily reduce reserves. According to our model, the loss of reserves through these actions would slow both aggregates, particularly M1. Finally, as economic growth accelerates, the Fed could raise interest rates, increase the interest rate offered on excess reserves, and begin selling assets. The resulting increase in market rates would tend to put a brake on M1 growth.
Disclaimer
The views expressed in this post are those of the authors and do not necessarily reflect the position of the Federal R
eserve Bank of New York or the Federal Reserve System. Any errors or omissions are the responsibility of the authors.


 RSS Feed
 Follow Liberty Street Economics
Interesting post! Thanks! I recently heard that changes to how the FDIC insurance premium is calculated (previously deposits held in the US, now total assets) induced banks to stop booking deposits abroad. This change was enacted in the beginning of 2011. Apparently part of the increase in the money aggregates can be explained via this channel. What is your opinion on this?
I’m almost sure the jump in M1 in the latter half of 2011 resulted from the collapse in treasury yields. But since you are using a 12 month average T-bill rate, and you are regressing on absolute rather than log changes, you probably missed the halving of the 1-year rate from 20 to 10 bps in Aug 2011, which made M1 a more perfect substitute for T-Bills. Why not use log spot yields in your regression? I don’t see why investors would be backward looking when making the T-Bill/deposit trade-off.
Thanks very much for all these ideas. To test the yield curve hypothesis, we’ve tried adding the 10-year Treasury yields to our model (previously, the model only included 1-year yields). This allows us to separately identify the effects of the slope and level of the yield curve on money growth. Adding the 10-year yield does improve the statistical fit of the model for M1, although not for M2. For both monetary aggregates, however, the “puzzle” remains — the current level of money growth is still well above the model predictions in recent quarters. To better account for precautionary motives for holding deposit balances, we also tried experimenting with including the VIX, an index of stock market volatility, in the model specification. This doesn’t seem to materially help explain recent patterns in money growth either, however. It’s certainly possible that substitution from repurchase agreements (“repo”) or other funding sources to deposits could help explain the recent behavior of M1 and M2. As a first test, we compared these two aggregates to growth in MZM, a broader measure of money growth that includes institutional money funds. This MZM series is growing at approximately the same rate as M2 (about 10% per year). It is true that the recent runup in money growth does approximately coincide with the introduction of the Federal Reserve’s Maturity Extension Program (MEP), also sometimes referred to as “Operation Twist” (for more details, a link to a previous Liberty Street Economics blog post on the MEP is pasted below). It is important to note that, unlike previous Fed large-scale asset purchase programs, the MEP doesn’t have a direct impact on bank reserve balances, since it involves purchasing longer maturity assets, but financing those purchases by selling short-term securities, rather than by crediting banks’ reserve accounts. It is possible, however, that the MEP still has other indirect effects on money growth; for example, if banks have a relative preference for holding shorter-term securities, they may have increased their holdings of these securities in response to the MEP, and financed these positions through deposits. Finally, the comment on FDIC insurance is definitely on point. Since late 2008, the FDIC has provided unlimited deposit insurance for certain types of noninterest-bearing accounts, initially through the Transaction Account Guarantee Program, and since December 2010 through an extension mandated in section 343 of the Dodd-Frank Act covering a narrower range of accounts. Since this insurance has been in place for more than three years, it seems unlikely to explain the higher M1 and M2 growth in recent quarters. But it could well be important in accounting for high overall money growth in recent years, especially in the case of M1. Importantly, the FDIC’s unlimited insurance coverage for noninterest-bearing transaction accounts is set to expire on December 31, 2012. This is a further factor likely leading to lower money growth in the future. To sum up: although there doesn’t seem to be a single “smoking gun” explanation for the increase in money growth at the end of our sample, these comments highlight a number of important factors which could help account for the recent behavior of M1 and M2. Thanks again for the suggestions. Link to October 2011 Liberty Street Economics blog post on the MEP: http://libertystreeteconomics.newyorkfed.org/2011/10/sizing-up-the-feds-maturity-extension-program.html
Dumb question, if a bank is not loaning out excess reserves, how does it “issue liabilities” and end up with more demand deposits. I’m trying to understand if the standard intro textbook story applies.
Could the unexpected recent rise represent a shift of large commecial funds out of their repo shadows and into the regulated banking system? Perhaps out definitions of M1 and M2 were too narrow before, as repo-d money market mutual finds can engage in similar money-creating fractional banking (through rehypothecation, etc) and be exposed to the same kind of runs.
Have you considered the role of unlimited FDIC insurance and the corresponding move of corporate cash from institutional money market funds to demand deposits? That would create a regime shift that would make it difficult to use parameters estimated prior to the change for predictions afterward.
If I may suggest the obvious I’d like to introduce the possibility that Operation Twist and the warmest Spring in 50 years may be conspiring together to boost monetary aggregates more than your model would predict.
Interesting article. Quite a mystery what is driving the model error in money growth. Have you looked at curve shape? i.e. 2s10s Treasury curve steepness as an explanatory factor? My only other suggestion would be to look at any foreign money flows into the USD as a flight-to-quality type move.