


The U.S. market share of world merchandise exports has declined sharply over the past decade. Throughout the 1980s and 1990s, approximately 12 percent of the value of goods shipped globally originated in the United States; by 2010, this share had dropped to only 8.5 percent. How can we account for the United States’ flagging merchandise export performance? Have U.S. manufacturing firms simply become less competitive than their foreign counterparts?
In a recent article and discussion paper, I investigate possible factors for the fall in the U.S. export share (illustrated below) and, to the extent possible, try to determine the importance that changing productivity of U.S. firms relative to their competitors has played. Productivity, in turn, is a key driver of an exporter’s sales in global markets compared to foreign firms selling similar products. What is at stake if productivity principally explains the evolution of U.S. export share? For one, it may have a bearing on trade policy. For instance, the effectiveness of a policy that opens foreign markets or otherwise promotes U.S. exports depends on the fundamental health and competitiveness of the export sector.
The most direct way to measure competitiveness due to productivity differences would be to compute relative productivity measures for all U.S. export industries. However, in many instances, and particularly for international comparisons, existing data are not detailed enough for that exercise. Thus, we take a “top-down” approach where, allowing for an effect of productivity differences, we examine other factors that might have lowered the U.S. export share and evaluate their importance. In this way, we can indirectly gauge the contribution of changes in the relative productivity of U.S. firms to movements in the U.S. export share.

Composition of World Trade
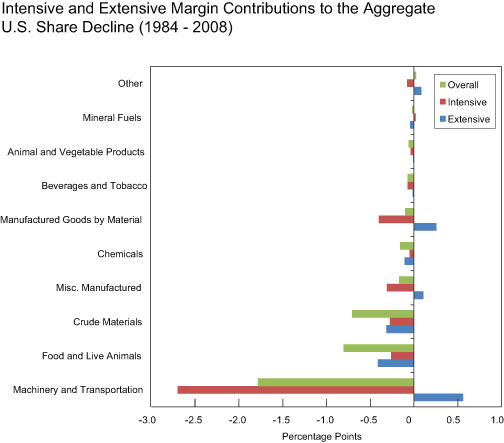
It turns out that two alternative factors can account for over half of the decline in the U.S. export share between 1984 and 2008. The first relates to the composition of world trade. If the rest of the world is increasingly trading goods that the United States does not produce, then the U.S. export share will fall—even if U.S. firms remain just as productive as their competitors in the goods that they do trade. We investigate this possibility by decomposing changes in the U.S. export market share into contributions from individual sectors, and find that only a handful of sectors contributed to the share decline. This trend is illustrated by the green bars in the figure below, where the overall decline in U.S. export share between 1984 and 2008 is dominated by three sectors: crude materials, food and live animal products, and machinery and transportation.

Among those industries that did contribute, a significant part of the decline was driven by the shrinking fraction of world trade claimed by those sectors, which we term an extensive margin. As shown by the red bars above, over half of the falling overall share in the crude materials and food and live animals sectors was accounted for by the shrinking relative size of those sectors in the basket of internationally traded goods. The remainder of the overall share decline is due to shrinking market share within those sectors, called the intensive margin, which has more to do with falling competitiveness. According to this measure, the United States did lose ground to its competitors in the export of certain products that were expanding briskly as a share of world trade—in particular, machinery and transportation products.
GDP Growth Relative to Foreign Exporters
The second factor that helps to explain the declining U.S. export share is the slower growth rate of the U.S. economy relative to that of its competitors. In a large body of research, the size of a nation’s economy has been shown to be an important determinant of the size of its international trade flows, with larger countries both importing and exporting more. Therefore, the brisk rate of, say, China’s GDP growth relative to that of the United States would imply a higher Chinese share and a lower U.S. share in traded goods markets.
To analyze the effect of relative GDP growth on the U.S. export share, we consider a model relating each nation’s export market share to its share of world GDP, geographic factors (such as the distance between import and export markets), and relative productivity. The share of world GDP and geographic factors are easier to measure than productivity, and therefore our approach is to remove their effect on market share. After removing the effects of relative GDP growth and geography on trade flows, what is left over—called the residual—contains information about the exporter’s productivity. Estimation of the model allows us to separate this residual from changes in relative GDP and the other variables in the model.
The main results of our estimation are summarized in the figure below, which shows the relative quantitative importance of the model prediction, based on the effects of relative GDP growth and geography, and the residual components of the overall U.S. export share. In 2008, the model prediction is about 15 percent below its level in 2000, accounting for about half of the 30 to 35 percent drop in the U.S. export share as shown in the figure. The residual, our measure of relative productivity, accounts for the other half. The model performs better in some periods than in others. In particular, the model tracks the flat periods in the market share series (1994-2000, 2005-08), but misses the decline in U.S. share in the early 2000s. By contrast, the residual declined sharply in the beginning of the 2000s—an indication that relative productivity fell at that time.

Finally, note that the breakdown above is distinct from our earlier intensive/extensive margin decomposition, meaning that the model
and residual each reflect, to some extent, both the intensive and extensive margins. What we can say is that because relative GDP growth accounted for half of the overall export share decline, and because changing export product composition was a significant contributor in several sectors, declining relative productivity accounted for less than half of the fall in market share. In other words, our measures suggest that U.S. relative productivity, albeit in decline, did not fall by nearly as much as the fall of the U.S. export share might suggest.
Disclaimer
The views expressed in this post, and in each of the presentations, are those of the author(s) and do not necessarily reflect the position of the Federal Reserve Bank of New York or the Federal Reserve System. Any errors or omissions are the responsibility of the author.
 RSS Feed
 Follow Liberty Street Economics
There are many details that also contribute massively to the declining US share of “world exports”. One factor is that in the past decade, the EU has expanded, the euro was created, and the European economy has integrated at a rapid pace. Exports and imports between European countries is booming: https://docs.google.com/spreadsheet/ccc?key=0AqtCUOT5AqgCdDhlRW1XcU1FXy1vTXdZWFB5Um82Rnc This has a big distorting effect on the data. It isn’t necessarily that the European economy has remarkable productivity growth or economic growth – the removal of trade barriers and use of a single currency causes massively increased trade volumes and trade arbitrage. That’s pretty irrelevant to US export performance, yet this has a massive impact on the denominator for America’s share of world exports. In this light alone, a rapid decline in America’s share of world exports is unremarkable and doesn’t mean much. Other similar confounding factors, along with those you describe, make it clear that share of world exports is the wrong target. Instead, America should focus on general productivity (both tradeable and non-tradeable sectors); political action and banking regulation must ensure that savings rates are sufficient to prevent too-severe a deterioration in America’s net national investment position. That’s all – forget the export fetish.