


Richard Peach
According to the Congressional Budget Office (CBO), under current policies the ratio of federal debt held by the public over gross domestic product—the debt-to-GDP ratio—will rise rapidly over the next decade. This unsustainable fiscal position presents the nation with two significant challenges. First, it requires fiscal consolidation that will, at a minimum, cause the ratio to level off in the not-too-distant future. Second, fiscal consolidation has to occur in a way that will keep the U.S. economy operating at as close to full employment as possible—a process known as rebalancing. While these challenges are very daunting, we’ve faced them before, and met them quite successfully in the mid-1980s through the mid-1990s. Using federal budget accounting and national income accounting, this post describes how fiscal consolidation and rebalancing were accomplished in the previous episode. By doing so, we can put our current fiscal position in perspective while shedding light on what needs to happen if we’re to be successful this time.
Our Current Fiscal Trajectory
Several times each year, the CBO publishes its “current law” baseline for the federal budget for the next decade. Presently, however, the “current law” baseline is not particularly useful for assessing the fiscal challenges the nation faces. For example, it assumes that all of the 2001-03 tax cuts expire at the end of 2012, that the alternative minimum tax begins to affect a substantially larger number of households, and that all of the provisions of the Budget Control Act of 2011 are fully implemented. But in its annual “Budget and Economic Outlook” report released this past January, the CBO provided an “alternative policy baseline,” which is in essence a “current policy” baseline. The chart and table below present revenues, outlays, and debt held by the public, all expressed as a percentage of GDP, under that alternative policy baseline, as well as the underlying economic and policy assumptions.

-Alternative-Policy-Baseline")
The picture is quite sobering. Under current policy, federal debt held by the public rises from about 70 percent of GDP currently to about 95 percent by fiscal year 2022.
The Mid-1980s to Mid-1990s Fiscal Experience
From 1981 to 1986, debt held by the public rose from 26 percent to 40 percent of GDP, prompting concern among policymakers and in financial markets domestically and abroad. Over the second half of the 1980s and first half of the 1990s, several pieces of legislation were enacted with the goal of restraining the growth of government outlays and raising revenues. By 1997, the federal deficit was essentially zero and the debt-to-GDP ratio, which peaked at a little over 49 percent in 1993, was beginning to decline.
The table below provides information on federal revenues and outlays, expressed as a percentage of GDP, for fiscal years 1987 and 1997. These years were chosen for two reasons. First, they approximate the beginning and end of the ten-year period we study. Second, the economy was essentially at full employment in both years. From 1987 to 1997, revenues rose by about 0.8 percentage point of GDP, from 18.4 percent to 19.2 percent, reflecting increases in corporate and individual tax revenues. Legislation enacted in 1990 and 1993 broadened the individual income tax base and raised marginal rates. Total outlays decreased by 2.1 percentage points of GDP, from 21.6 percent to 19.5 percent, with defense outlays declining by 2.8 percentage points—known as the “peace dividend.” Meanwhile, mandatory spending, particularly on Medicare and Medicaid, rose by 0.8 percentage point. Net interest was unchanged at 3 percent of GDP, despite the increase in debt held by the public, due to generally declining interest rates over the period. (The average interest rate on marketable Treasury debt fell from around 8.7 percent at the end of fiscal year 1987 to 6.7 percent at the end of fiscal year 1997.)

Also included in the table are the corresponding values for fiscal year 2011. Federal receipts were just 15.4 percent of GDP, reflecting ongoing cyclical weakness as well as policy decisions, such as the 2 percentage point reduction in the OASDI (Old-Age, Survivors, and Disability Insurance) payroll tax. Outlays were relatively high at 24.1 percent of GDP, with discretionary outlays closer to their 1987 levels than their 1997 levels. Mandatory spending (or entitlements) was 13.6 percent of GDP, due to higher levels of outlays for Social Security and Medicare/Medicaid as well as increased outlays for income security categories such as unemployment insurance and food stamps. Debt held by the public had increased to 67.7 percent of GDP. Nonetheless, net interest was down to 1.5 percent of GDP, reflecting further declines in interest rates.
How Did the Economy Adjust?
Recall that the U.S. economy was operating near full employment in 1987 when the fiscal consolidation began. There was a relatively brief and shallow recession between fourth-quarter 1990 and first-quarter 1991. However, this was followed by an extended period of very sluggish employment growth (the first “jobless recovery”) in which the unemployment rate continued to rise, not peaking until mid-1992, and then declining only gradually. But by 1997, the economy was back to full employment.
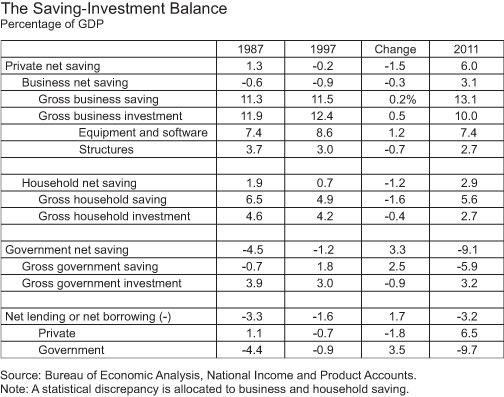
How did the U.S. economy adjust to this significant increase in government saving? The next table presents data on the balance between gross saving and gross investment for the government, household, business, and external sectors. The table is derived from the fact that saving must equal investment because the total of the expenditure side of the national accounts must equal the income side. This in turn requires that the net saving balances (gross saving minus gross investment) across the four sectors sum to zero. In particular, the sum of net saving balances in the three domestic sectors equals the amount of U.S. lending or borrowing from abroad. Private net saving is the sum of business net saving and household (and nonprofit institution) net saving, while government net saving includes saving by federal as well as state and local governments.

So, how did these balances evolve from 1987 to 1997, when the government’s net saving balance increased by 3.3 percentage points of GDP? The increase in the government’s saving balance was partially offset by a 1.6 percentage point decline in the private sector saving balance. Business net saving declined by 0.3 percentage point of GDP, due primarily to an increase in gross business investment. Household net saving declined by 1.3 percentage points of GDP, owing mainly to a 1.7 percentage point decline in gross household saving. With government net saving up by 3.3 percentage points of GDP and private net saving down by only 1.6 percentage points, the remainder of the rebalancing was achieved by a 1.7 percentage point decline in net borrowing from abroad.
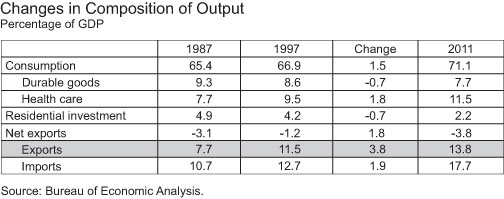
The shifts in net saving balances resulted from significant changes in the composition of U.S. output. In particular, the decline in household net saving reflected the roughly 1.5 percentage point increase in consumption as a share of GDP. This increase was more than accounted for by increases in consumption of services, with health care services playing a key role in that rise. Consumer spending on durable goods fell as a share of GDP. In addition, the decline in net borrowing from abroad corresponded to an increase in exports of 3.8 percentage points of GDP, which was offset in part by a 1.9 percentage point gain in imports.

The Current Fiscal Position
The final column of the Saving-Investment Balance table presents data for 2011. As of 2011, government net saving was in a deficit equal to nearly 10 percent of GDP. Part of this negative saving is due to the fact that the economy operated well below full employment. But even after full employment is restored, government net saving would have to increase by 3 to 4 percentage points of GDP, comparable to what occurred from 1987 to 1997.
As the increase in government saving occurs, some combination of declining private net saving and declining borrowing from abroad must take place if the U.S. economy is to achieve and maintain full employment. Net household saving is slightly above its long-run average of around 2 percent of GDP, and is likely to decline somewhat as the deleveraging process winds down and housing construction returns to a level consistent with demographic trends. However, consumption already represents a historically high share of GDP. At 6 percent of GDP, net business saving is well above its long-run average of around -0.75 percent; thus, it seems to be a prime candidate to decline through a combination of increased investment and reduced gross saving. Similarly, the current account deficit could contribute through some combination of rising exports and declining imports. This in turn suggests that changes in fiscal policy intended to reduce future deficits will have to simultaneously increase the relative attractiveness of the United States as a destination for businesses to invest and produce.
Disclaimer
The views expressed in this post are those of the author and do not necessarily reflect the position of the Federal Reserve Bank of New York or the Federal Reserve System. Any errors or omissions are the responsibility of the author.

Richard Peach is a senior vice president in the Research and Statistics Group of the Federal Reserve Bank of New York.
 RSS Feed
 Follow Liberty Street Economics