Basit Zafar, Olivier Armantier, Scott Nelson, Giorgio Topa, and Wilbert van der Klaauw
Managing consumers’ inflation expectations is of critical importance to central banks in the conduct of monetary policy. But managing inflation expectations requires more than just monitoring expectations; it also requires an understanding of how these expectations are formed. In this post, we present results from a new study that investigates how individual consumers use selected information on food prices in forming their inflation expectations. While the provision of this information leads individuals to meaningfully revise expectations of their own-basket inflation rate, we find there is little impact on expectations of overall inflation.
In early 2011, we conducted an information-based experiment embedded in an online survey, in which we randomly provided a subset of 667 respondents with information about past-year average food price inflation. Before this subset of respondents received this information, and again after this subset received this information, we asked all respondents for their expectations of year-ahead inflation. This experimental design creates a unique panel dataset to observe how respondents update their inflation expectations in response to this selected information. We chose to provide respondents with past-year average food prices because food purchases tend to be frequent and changes in food prices are generally more volatile and salient, which could systematically bias respondents’ perceptions of past food price inflation and overall inflation as recent working papers have shown (see Bruine de Bruin et al. and Georganas et al.).
If past-year food price information is relevant for inflation expectations, then we expect respondents who, prior to receiving the selected information, are less informed about it to find the information more valuable and to be more responsive to it. Therefore, to gauge respondents’ familiarity with the selected information, we ask: “Over the last twelve months, by how much do you think the average prices of food and beverages in the U.S. have changed?” The respondents who were randomly assigned to receive the selected information (the information group) were then informed that food/beverage price inflation in the U.S. had been 1.39 percent over the last twelve months, based on data from the Bureau of Labor Statistics. Respondents in the control group did not receive this information. We measure respondents’ “Perception Gap” as the difference between the objective information value (1.39 percent) and respondents’ prior beliefs; a negative perception gap corresponds to overestimation of past food/beverage price inflation.
We find that respondents have inaccurate perceptions of past changes in food and beverage prices. The average perception gap in our sample is -4.92 percentage points (meaning respondents report past food/beverage price inflation, on average, to be 6.31 percent). We find that nearly 40 percent of our respondents believe past-year food and beverage price inflation was 7 percent or more, when, in fact, the published measure has not risen as high as 7 percent since 1981.
So, if the selected information is useful for respondents in forming inflation expectations, and if respondents find the information to be reliable, then we would expect our information treatment to have a causal impact on inflation expectations in the information group, especially for respondents with high perception gaps. More specifically, respondents who overestimate food/beverage price inflation (those with negative perception gaps) should revise inflation expectations downwards, and the converse should be observed for respondents with positive perception gaps. That is, revisions in inflation expectations should be positively related to perception gaps, and the larger the perception gap, the larger should be the revision in inflation expectations. Meanwhile, there should be no systematic relationship between revisions and perception gaps for the control group.
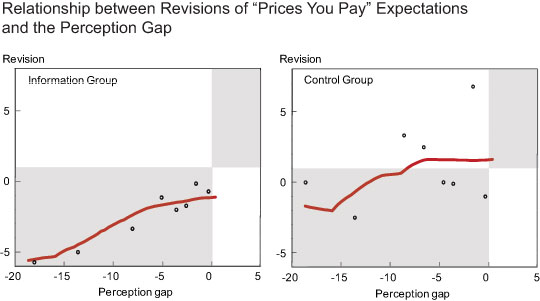
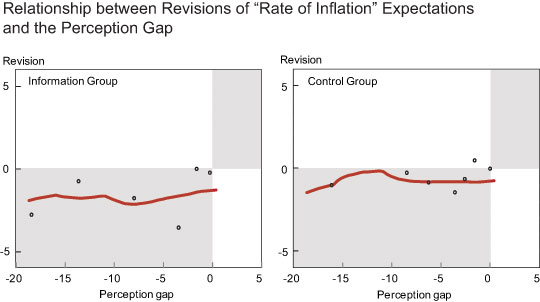
The two figures below look for these expected patterns by plotting respondents’ mean revisions in inflation expectations and perception gaps by deciles. Each point in the figures shows the mean revision by percentile gap deciles (because some deciles overlap, the figures have fewer than 10 points). Our experiment actually used two different question wordings to elicit inflation expectations: we randomly asked half of our respondents for their expectations of overall inflation (the “rate of inflation”; RI) while we asked the other half of respondents for the expectations of their own-basket inflation (the “prices of things you usually spend money on”/“prices you pay”; PP). The latter question is similar to the one used in the University of Michigan Survey of Consumers, which produces the often-cited monthly measure of consumer inflation expectations. The Michigan question asks about “prices in general,” and we have found in previous research that it often tends to be interpreted by respondents as asking about prices that they are paying.
The previous figure shows data for the PP respondents, where we observe the expected positive relationship between perception gaps and revisions for the information group. For the information group, we see: (1) all the data points fall in a gray quadrant, that is, mean revisions are in fact negative for negative perception gaps, and (2) there is a clear positive relationship between mean revisions and perception gaps (the line depicting the relationship between the data is upward sloping and lies in the gray quadrants). The control group, however, does not show the same features: all data points do not lie in the gray quadrants, and the relationship between mean revisions and perception gaps is not unambiguously positive (in fact, the slope is not statistically different from zero).
On the other hand, in the figure below which shows data for the RI respondents, the relationship between revisions of overall inflation (RI) expectations and the perception gap is flat for the information and control groups. That is, information about past food/beverage prices does not lead to revisions in expectations about the year-ahead rate of inflation. The greater response of own-basket inflation (PP) expectations to food price information, relative to overall inflation (RI) expectations, may be a consequence of either (1) food price changes being perceived to have more relevance for consumers’ own-basket inflation rate than for the overall inflation (note that food and beverages accounted for only 14.8 percent of the Consumer Price Index (CPI) in 2011), (2) consumers having biased perceptions about the share of food expenditures in their budget, or (3) consumers focusing on specific salient price changes when considering the change in “prices” rather than “inflation.”
Our results suggest that consumers incorporate information about past food prices in forming and updating their own-basket inflation expectations but not their overall inflation expectations. The issue of pass-through to inflation is of particular concern during times of large supply shocks. Our finding that information about past food price inflation has limited pass-through to consumers’ expectations of the “rate of inflation” suggests that the RI question (and not the PP question, which as mentioned above is similar to the one used in the Michigan survey) is a more stable survey question (in the sense that it is less susceptible to volatile price changes), and that it should instead be used to elicit consumer inflation expectations.
However, if measures of own-basket inflation continue to be monitored and used by policy makers, or if consumers respond to own-basket inflation expectations when making decisions, then public information campaigns about past (food) inflation may have a role as part of prudent monetary policy: our results suggest that such information dissemination may lead to more informed and reliable reporting of own-basket inflation expectations by consumers. As to how policy-makers can effectively deliver this information remains a challenge. The measure which we provided information on, past food prices, is after all easily accessible public information. The question then is why consumers do not already seek out, or do not pay attention to, such information when they in fact find it useful.
Disclaimer
The views expressed in this post are those of the authors and do not necessarily reflect the position of the Federal Reserve Bank of New York or the Federal Reserve System. Any errors or omissions are the responsibility of the authors.

Basit Zafar is an economist in the Federal Reserve Bank of New York’s Research and Statistics Group.

Olivier Armantier is an assistant vice president in the Federal Reserve Bank of New York’s Research and Statistics Group.

Scott Nelson is a former assistant economist in the Federal Reserve Bank of New York’s Research and Statistics Group.

Giorgio Topa is a vice president in the Federal Reserve Bank of New York’s Research and Statistics Group.

Wilbert van der Klaauw is a vice president in the Federal Reserve Bank of New York’s Research and Statistics Group.


 RSS Feed
 Follow Liberty Street Economics