Richard K. Crump, Stefano Eusepi, and Emanuel Moench
The Federal Open Market Committee (FOMC) statement released on August 9, 2011, was the first to incorporate language on “forward guidance” with an explicit date tied to the Committee’s expected path of monetary policy. In this post, we exploit the timing of surveys taken before and after this statement’s release to investigate how professional forecasters changed their expectations of growth, inflation, and monetary policy. We find that the average forecast of the federal funds rate shifts considerably and closely aligns with the new language in the statement, while the average forecasts for growth and inflation change less. While there’s near unanimity among forecasters about the future path of the federal funds rate after the August 2011 FOMC statement, forecasters maintained differing views on the growth and inflation outlooks.
The August 2011 FOMC statement included the following excerpt:
The Committee currently anticipates that economic conditions—including low rates of resource utilization and a subdued outlook for inflation over the medium run—are likely to warrant exceptionally low levels for the federal funds rate at least through mid-2013.
The phrase “at least through mid-2013” replaced the former language, which read “for an extended period.” It’s generally difficult to assess the change in expectations of professional forecasters before and after an event such as an FOMC meeting because surveys are relatively infrequent (generally, monthly or quarterly), whereas economic data and news are released much more often. In this instance, however, we can use data from two well-known surveys of professional forecasters to investigate this issue. The two surveys—the Blue Chip Financial Forecasts (BCFF) and the Blue Chip Economic Indicators (BCEI)—are conducted monthly and ask participants, ranging from broker-dealers to economic consulting firms, to provide forecasts of the future path of selected economic and financial variables. We take advantage of two aspects of the BCFF and the BCEI surveys: First, they were conducted relatively close to either side of the August 9, 2011, FOMC meeting; second, they have twenty-seven professional forecasters in common. This overlap essentially allows us to turn a monthly survey into a semi-monthly one, as shown in the following timeline:
In addition to the BCFF surveys taken in late July and August and the BCEI survey taken in early August, the timeline makes special reference to the July 29 Advance GDP report. This report included “benchmark revisions” for real GDP back through 2007, and indicated that the output declines in late 2008 and early 2009 were even sharper than previously thought. Because this information likely had a significant impact on professional forecasters’ expectations, it’s important to control for its effect. We recognize, however, that the relatively long gap of approximately two weeks between the meeting and the BCFF survey is an impediment to our design. Over that period, there were other economic data releases and events occurring outside the United States that likely influenced expectations.
We focus on two simple measures to characterize the distribution of forecasts across our twenty-seven forecasters: the mean across them (the “consensus” forecast) and the dispersion across them (forecaster “disagreement”). The latter measures the difference in opinions of professional forecasters at a given time. We examine disagreement because looking at the mean alone might not provide a complete picture of forecast changes. For example, small changes in consensus forecasts might mask significant and diverging changes in individual forecasts. The table below reports the consensus forecasts for real GDP growth as well as CPI inflation for the twenty-seven common participants in the two surveys and the overall consensus from each survey. We first note that the forecasts across the two groups are very similar, suggesting that the twenty-seven common forecasters are representative of the entire sample. The table also shows that consensus forecasts for 2012 annual GDP growth declined after the GDP release on July 29 as well as after the August 9 FOMC meeting, while the consensus forecast for 2012 inflation was little changed.
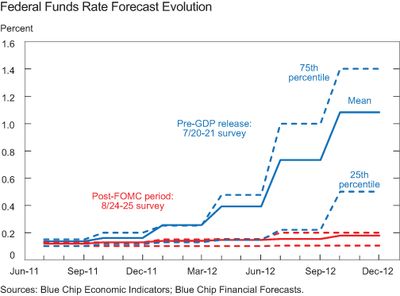
In sharp contrast, consensus forecasts for the federal funds rate fell dramatically following the FOMC meeting, as shown in the chart below. Indeed, the consensus forecast of the rate from the BCFF survey of August 24-25 (the solid line) is consistent with the “forward guidance” language in the statement, as it remains slightly above zero through 2012.
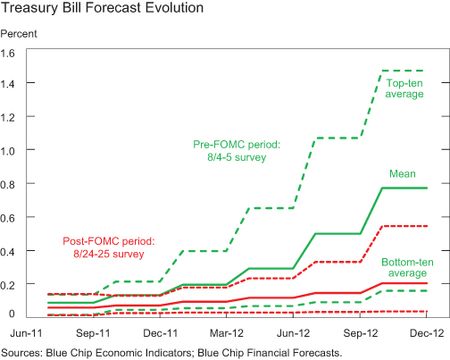
How much of this decline in policy rate expectations is attributable to the FOMC meeting? The next chart shows the shift in the forecast for the three-month Treasury bill after the GDP release (but before the FOMC meeting) and after the FOMC meeting. Because the BCEI doesn’t collect forecasts of the federal funds rate, we use the Treasury bill forecast as a proxy. The chart suggests that the bulk of the stark drop in the rate forecasts from late July to late August didn’t occur after the GDP release, but instead after the FOMC meeting.
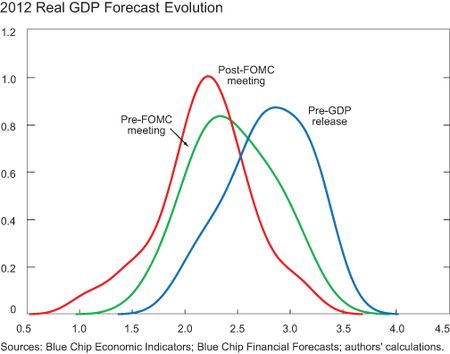
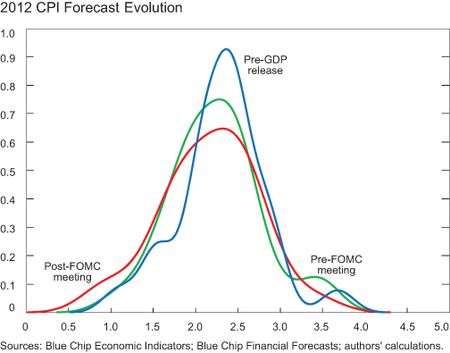
The next two charts relate to the issue of forecaster disagreement, and show three estimated distributions for 2012 GDP and CPI forecasts across our twenty-seven forecasters corresponding to the pre-GDP, pre-FOMC, and post-FOMC surveys, respectively. While the distribution of real GDP forecasts shifted sequentially toward slower growth, it also became more concentrated around the lower mean, indicating a modest decline in “disagreement,” especially after the FOMC meeting. At the same time, the distribution of the inflation forecasts doesn’t exhibit a shift in the consensus, but instead displays an increase in disagreement after the GDP release and after the FOMC meeting.
In contrast to the GDP and inflation forecasts, the change in the forecast distribution for the federal funds rate is dramatic. The lines in the first chart above show the forecast in the 25th and 75th percentiles before (the blue line) and after (the red line) the FOMC meeting. These indicate that disagreement about the future path of the federal funds rate effectively vanished. In particular, while thirty-five of the forty-five participants in the survey before the FOMC meeting were expecting the rate to be above 0.3 percent in fourth-quarter 2012 (the longest forecast horizon available in the survey), the survey after the FOMC meeting saw only two of the forty-six participants submit forecasts for the federal funds rate above 0.3 percent for fourth-quarter 2012. One month later, only one of thirty-eight survey participants submitted a forecast for the rate above 0.3 percent for first-quarter 2013 (and none above 0.3 percent for fourth-quarter 2012). There was a similar compression in disagreement in the evolution of the Treasury bill forecast.
Summing up, we note that the Blue Chip survey showed that the FOMC announcement in August 2011 produced a sizable effect on the participants’ expected future path of monetary policy. Forecasts were revised in a manner that appears to be aligned with the FOMC’s expected path as characterized in the “forward guidance” language of the statement. Forecasters also adjusted their GDP growth and CPI forecasts after the FOMC statement, but to a lesser degree. Unfortunately, we can’t observe the counterfactual set of forecasts in a world where there was no change to the “forward guidance” language in the statement. Consequently, we can’t determine whether professional forecasters perceived the new statement language as an effective tool to stimulate economic activity and affect inflation expectations.
Disclaimer
The views expressed in this post are those of the authors and do not necessarily reflect the position of the Federal Reserve Bank of New York or the Federal Reserve System. Any errors or omissions are the responsibility of the authors.
Richard K. Crump is a senior economist in the Research and Statistics Group of the Federal Reserve Bank of New York.
Stefano Eusepi is a senior economist in the Research and Statistics Group.
Emanuel Moench is a senior economist in the Group.


 RSS Feed
 Follow Liberty Street Economics