Jan J.J. Groen, Kevin McNeil, and Menno Middeldorp
An oil-price spike is often used as the textbook example of a supply shock. However, rapidly rising oil prices can also reflect a demand shock. Recognizing the difference is important for central bankers. A supply-driven increase in the price of oil can result in higher unemployment and inflation, leaving central bankers with the difficult decision to loosen policy, tighten policy, or not respond at all. A demand-driven increase reflecting global growth may support the case for tighter policy. In this post, we describe an approach for decomposing oil price changes into supply and demand shocks using financial market data.
Financial Markets and Oil-Price Shocks
While it’s not possible to measure supply and demand shocks directly, we identify them by looking at their impact on financial prices. For example, when the price of oil goes up, then equity markets of oil exporters and the prices of oil stocks tend to rise compared to other countries or sectors, regardless of the type of shock. However, if supply constraints are raising prices, then the currencies and equity markets of oil importers usually decline, accompanied by the underperformance of cyclical stocks and outperformance of defensive stocks relative to the overall equity market. Conversely, if global aggregate demand pushes up the price of oil, then we typically see the opposite patterns, accompanied by higher interest rates and the depreciation of safe-haven currencies. Other commodity prices tend to be positively correlated with the price of oil, although the strength of this correlation is weaker in the case of an oil supply shock than in the case of a demand shock. Finally, the net number of long positions (those buying the right to receive oil in the future minus those promising to deliver) of noncommercial oil traders (those not associated with firms processing oil) is slightly more positively correlated with the price of oil during a supply shock than during a demand shock.
We can also consider the effect on oil prices from the risk of future supply constraints or the expectation of future economic growth. For example, supply concerns about Iran’s nuclear program probably contributed to higher prices even before the United States and the European Union imposed an oil embargo. Similarly, volatility in the price of oil during the Great Recession was attributed to rapidly changing expectations about demand.
Decomposing Oil-Price Changes Related to Supply and Demand
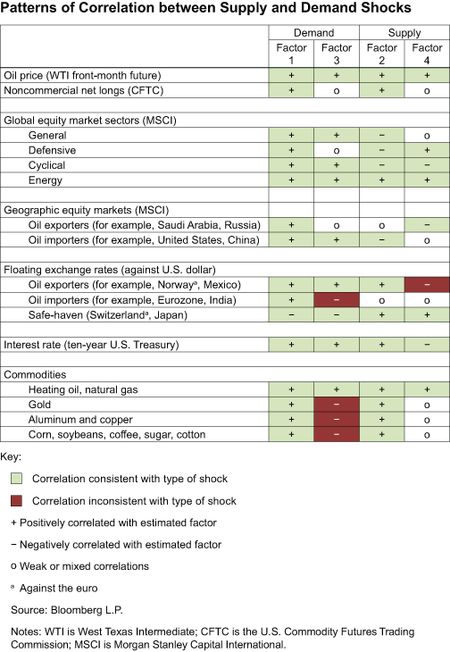
Partial least squares (PLS) is a technique we use to construct linear combinations of the variables in our financial market data set—called factors—which have maximum explanatory content for oil-price changes. We first use this procedure to generate factors that best capture the patterns in the data, and then examine the estimated factors to determine if they resemble a demand or supply shock. Using data from 1995 onwards, we extract the factors from monthly oil-price changes and seventy-four time series in the categories listed in the table below.
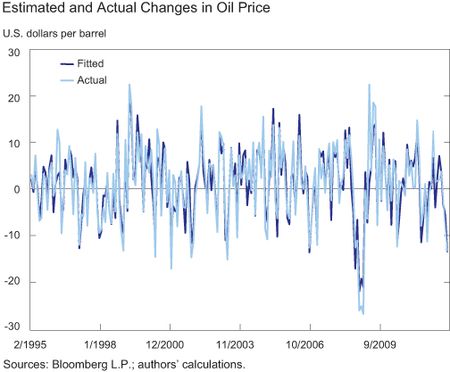
The order of the factors reflects how well they fit the data. We want to use a few factors to explain most of the variation in the data. The results from regressing these factors on oil-price changes reveal that the first two factors can explain 65 percent of the variation (R-squared), with the first four explaining 81 percent (see chart below). Additional factors didn’t increase explanatory power notably.
The four factors are identified as two demand and two supply shocks, with the identification achieved in three stages. First, we examine the correlations of the factors with our data to see if they match the expected patterns. Second, we check the factors against other measures that are likely related to supply or demand shocks. Third, we compare the factors with an oil-price decomposition constructed by other researchers using a different technique.
The table summarizes pair-wise correlations between the factors and the underlying data series. In the case of the first and second factors, the observed direction of the correlations closely matches the earlier described expected pattern for a demand and supply shock (reflected in the table by the light green shading). The third and fourth factors show a less clear match, with either weak or mixed correlations (reflected by the “o” marks) within the categories or correlations inconsistent with the identified shock (reflected by the dark red shading).
We check our interpretation by running regressions between the factors and several indicators related to global economic growth, oil-market supply, and global risk perception. Our demand factors are significantly related to the OECD leading indicators for the G-7 countries and China. The second factor—the main supply factor—is significantly related to reported OPEC spare capacity and the Economic Intelligence Unit’s political risk indices for Middle East and Northern African countries (weighted by their oil production). Finally, both supply factors are negatively correlated with VIX S&P 500 option volatility, often called the “fear index,” fitting the notion that a supply shock is bad news for the global economy.
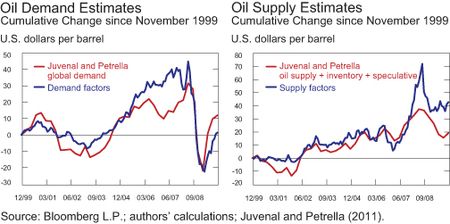
We also confirm our interpretation by comparing our decomposition with that in a paper by Juvenal and Petrella (2011). Our demand factors together show a pattern similar to the oil-price history the authors attribute to “global demand” (see left chart below). Furthermore, our supply factors match much of the oil-price changes they identify as arising from “global supply,” “inventory,” or “speculative” forces (see right chart).
A Brief Supply-Demand History of Oil Prices
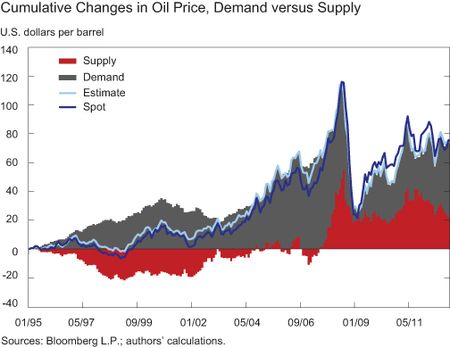
Our decomposition of the price of oil is shown in the next chart, which represents cumulative changes since January 1995, not the actual level of the price of oil. The estimated changes fit the actual changes well. The decomposition
also matches conventional interpretations of conditions in the oil market. The 1990s were generally seen as a period of excess oil supply. The next decade shows a rise in global demand, eventually reaching the limits of supply in 2007. Prices then fell dramatically, as demand declined due to the global contraction during the financial crisis and consequently supply became less constrained. Demand again increased during the global recovery. Supply pressures re-emerged, with both feared and actual supply disruptions around the “Arab Spring,” especially with the shutdown of Libyan production and increased tension regarding Iran’s nuclear program. Since that time, Iran’s oil exports have been embargoed, while Libyan production has returned to near-normal levels; Iraqi production has increased meaningfully, and Saudi Arabia has kept its production elevated, serving to temper the effect of supply constraints on oil prices.
In conclusion, our analysis helps identify the 1990s as a period of excess supply in the oil market, and the 2000-09 period as one in which demand factors were dominant. More recently, supply pressures appeared again as major oil-price determinants.
Disclaimer
The views expressed in this post are those of the authors and do not necessarily reflect the position of the Federal Reserve Bank of New York or the Federal Reserve System. Any errors or omissions are the responsibility of the authors.
 Jan J.J. Groen is an officer in the New York Fed’s Research and Statistics Group.
Kevin McNeil is a trader/analyst in the New York Fed’s Markets Group.


 RSS Feed
 Follow Liberty Street Economics