Joseph Tracy, Richard Peach, and Joshua Abel
An assiduous follower of the national house price charts that the New York Fed maintains on its web page may have noticed that we appear to be rewriting history as we update the charts every month. For example, last month we reported that the median twelve-month house price change across all counties for December 2012 was 3.68 percent. However, this month, we indicate that this same median change for December 2012 was instead 3.45 percent. Why the change? Was the earlier reported number a mistake that we simply corrected this month? If not, what explains the revision to the initial report?
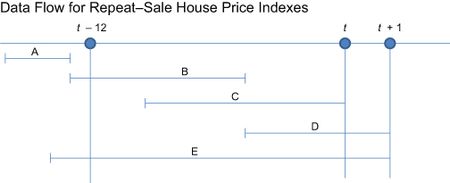
The house price appreciation rates that we summarize in our figures and charts are based on repeat-sale house price indexes, meaning they compare a home’s sale price to the price it sold for in its previous sale. A feature of these indexes (regardless of who produces them) that may not be familiar to all readers is that they are continuously revised as new information on housing sales becomes available. To understand this process, consider the stylized data flow depicted in the exhibit below. Each different line in the exhibit represents the time between a purchase and a subsequent sale of a specific property. In period t, we are interested in estimating the percent change in house prices over the past twelve months. When we first calculate this house price change at date t, two sales are available to inform this calculation—sales B and C. For both of these sales, the “holding period”—the time between the purchase and the subsequent sale of the property—overlapped with the twelve-month period that we want in order to estimate the house price change. Sale A, however, does not impact this calculation, since its holding period does not overlap our twelve-month window, and sales D and E have not yet taken place.
One month later, at date t+1, when we go back to recalculate the house price increase over our earlier twelve-month window, two additional sales—sales D and E—are now available, and their holding periods overlap our twelve-month window (either entirely as in E, or partially as in D). The change in the prices for these two properties represents new information that was not available to us the previous month to inform our calculation of the house price change over our twelve-month window. As a result, we are likely to revise our earlier estimate of this house price change when we incorporate this new information. One can imagine that as time moves forward, more and more new transactions, with a wide array of holding periods, will be incorporated into the index. Eventually, the flow of new information will begin to decline relative to the existing stock of information, and the revision process will play out. But like all good things, that will take some time—only in the distant future will we really know exactly what happened to house prices recently.
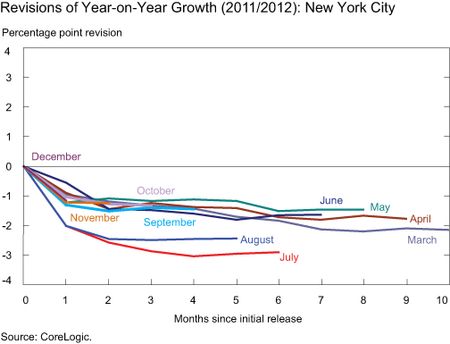
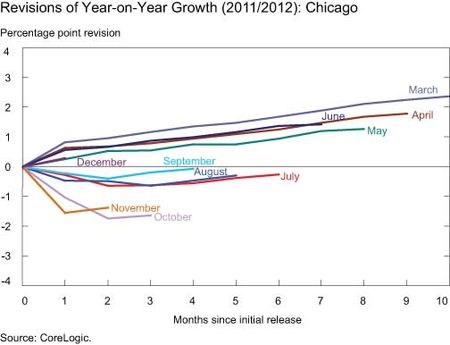
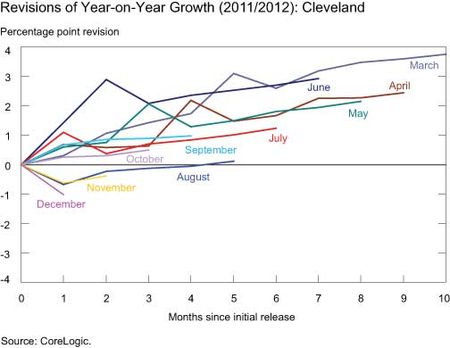
Knowing that recent house price changes will be revised does not tell us how they will be revised. The panels of the chart below illustrate the recent revision pattern for three different metropolitan areas. Each line traces the revision for a twelve-month house price change for a particular month relative to the initial reported change—positive (negative) numbers indicating that the initial reported change has been revised higher (lower) based on subsequent information. The first panel is for New York City (NYC), where we see that the initially reported twelve-month changes from March through December of 2012 have consistently been revised down as new information has become available. The middle panel is for Chicago, Illinois, where about half of the initial reports have been revised upward and the others downward. The final panel is for Cleveland, Ohio, where most of the initial reports have subsequently been revised higher.
Another feature of the panels above is that the magnitudes of the month-to-month revisions tend to dampen as time moves forward, away from the initial release date. That is, the good news is that typically a large percentage of the final revision will reveal itself relatively early following the initial release. The magnitudes of these early revisions, however, are likely to be relatively larger now than prior to the housing bust. Our web page shows the relative transaction volume of repeat-sales as compared to the average transaction volumes over the period from 2000 to 2002 (see the Charts tab). What is clear is that repeat-sale transaction volume is still very low in most housing markets. This means that the initial release of a house price change for any market will be based on a smaller set of transactions, so it will be subject to more significant revisions in the future.
It should be noted that revisions in most metropolitan areas behave more like those of Chicago rather than those of New York or Cleveland, with roughly half of the revisions upward and about half downward. But the above panels demonstrate the important effect that revisions can have—our understanding of how home prices evolved in early 2012 in, say, New York City, is far different now than it was as the data were initially being released. For instance, in March 2012, the initial estimate was that home prices in NYC in 2012:Q1 grew 3.5 percent (a 14.7 percent annualized rate!). However, in the most recent reading of the data, the 2012:Q1 growth in NYC house prices was a more modest 1.4 percent (5.7 percent annualized). While this still suggests that the housing market in NYC was firming in 2012:Q1, it clearly would have been a mistake to get too excited about the initial reading.
Data revisions can have consequences that are far from trivial. Housing prices are viewed by many as an important economic indicator. In fact, much of the recent optimism regarding the prospects for a more vigorous recovery of the economy is due to evidence that the housing market is firming. Home price indexes are an important component of this information. Furthermore, if the revisions can be significant, then this creates a challenge for using these indexes in financial contracts. Timely contract settlement could lead to one party delivering a sum of money that, with the benefit of more data and thus index revisions, turns out to be too much or too little. And as noted earlier, due to the very low sales volume of recent years, we are currently in a time when these concerns regarding revisions are amplified, since a relatively small proportion of the sales that will ultimately be used to calculate the “final” home price index have been transacted to date.
Repeat-sale house price indexes have a number of very nice features, which account for their popularity. Importantly, they compare the sale price of the same properties at two or more points in time, which helps to hold the quality of the properties constant when estimating the price changes. However, when using these indexes, we have to wait until the future to know what has happened in the past. Initial estimates of house price changes will get revised over time so one should not get too attached to any given reported house price change.
Disclaimer
The views expressed in this post are those of the authors and do not necessarily reflect the position of the Federal Reserve Bank of New York or the Federal Reserve System. Any errors or omissions are the responsibility of the authors.
 Joseph Tracy is an executive vice president and senior advisor to the Bank president at the Federal Reserve Bank of New York.
 Richard Peach is a senior vice president in the Research and Statistics Group of the Federal Reserve Bank of New York.
 Joshua Abel is a senior research analyst in the Research and Statistics Group of the Federal Reserve Bank of New York.


 RSS Feed
 Follow Liberty Street Economics