Parinitha Sastry and David Skeie
Peel back the layers of complex financial institutions and instruments, and you’re left with individuals demanding to be paid, and to be paid quickly. Payments are the electricity that powers the entire financial system. The ability to securely send and receive timely payments is a prerequisite for commerce and the smooth functioning of financial markets. Despite the seemingly straightforward nature of the subject, a preliminary exploration of payments data offers insight into how institutions react to changing economic conditions. In this post, we aim to investigate recent volatility in the amount of payments, particularly during the recent financial crisis. We focus on estimating and extracting changing levels of payments required for interbank lending, which reflect banks’ varying needs for liquidity. We find that variables capturing macroeconomic conditions and financial market stress are additional large drivers of fluctuations in payments.
Depository institutions and government agencies make trillions of dollars in payments every day. The Fedwire® Funds Service is the Federal Reserve’s payments network over which billions of dollars can flow within seconds throughout the country. Just as payments are the electricity of the financial system, the Fedwire Funds Service is the circuitry. The service allows over 7,000 depository institutions and other participants to electronically transfer funds to each other on behalf of themselves and their customers, which include deposit account holders and other financial institutions. Additionally, the Fedwire Funds Service plays a versatile payments role for a variety of institutions other than depository institutions, including foreign exchange settlement groups, the U.S. Treasury, and other federal and international agencies (for more on the operation of the service, see this August 2012 post).
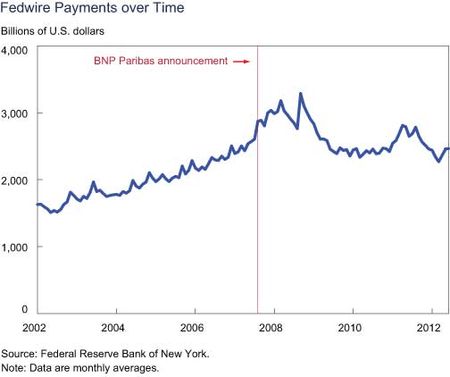
Between 2002 and 2008, the value (dollar volume) of payments grew steadily upward. However, as the chart below shows, this trend becomes more volatile after the onset of the financial crisis, the start of which we identify as BNP Paribas’ announcement to freeze three asset-backed-securities investment funds when the securities couldn’t be fairly valued.
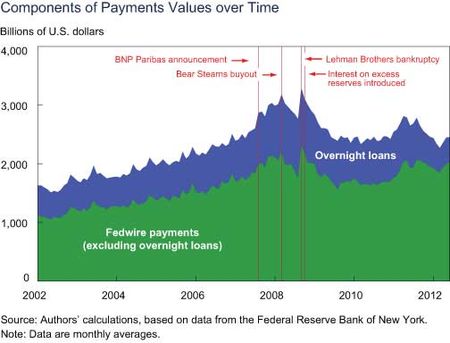
Much of the dramatic fluctuations in Fedwire payments become more muted after one removes overnight loans made or intermediated by banks, which are a primary set of transactions that pass through the Fedwire Funds Service. Overnight loans are a key source of short-term funding for banks, particularly when they’re strapped for cash. We estimate such loans using a statistical algorithm originated by former Fed economist Craig Furfine that aims to match payments over the Fedwire Funds Service into corresponding pairs. By way of disclaimer, we note that, historically, algorithms based on the work of Furfine have been used as a method of identifying overnight or term federal funds transactions. The Research Group of the Federal Reserve Bank of New York has recently concluded that the output of its algorithm based on the work of Furfine may not be a reliable method of identifying federal funds transactions. (It should be noted that for its calculation of the effective federal funds rate, the Federal Reserve Bank of New York relies on different sources of data, not on the algorithm output.) The output of the algorithm may include transactions that are not fed funds trades and may discard transactions that are fed funds trades. Some evidence suggests that these types of errors in identifying fed funds trades by some banks may be large. This post therefore refers to the transactions that are identified using the Research Group’s algorithm as overnight or term loans made or intermediated by banks. Use of the term “overnight or term loans made or intermediated by banks” in this post to describe the output of the Research Group’s algorithm is not intended to be and should not be understood to be a substitute for or to refer to federal funds transactions.
As one can glean from the chart below, even after we remove these overnight loan transactions from the data set, we still observe a fluctuating series, with a large run-up in payments leading to the financial crisis and extreme fluctuations in Fedwire payments levels thereafter.
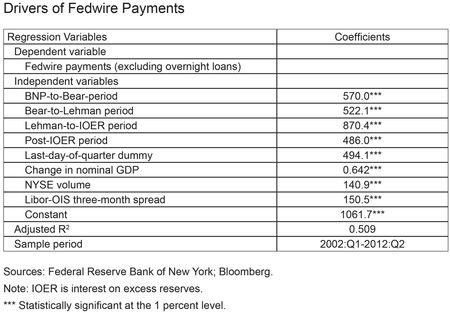
A simple linear regression on traditional macroeconomic and financial variables illuminates what drives the fluctuation in payments activity. We include in the regression (see table below) the three-month spread between the London interbank offered rate (Libor) and the overnight indexed swap (OIS) rate, a measure of financial market illiquidity and banking financial distress, as well as New York Stock Exchange (NYSE) volume as a measure of financial market activity. GDP is included to account for general movements in the economy at large, and a last-day-of-quarter dummy captures any end-of-quarter “window dressing” effects. Finally, period dummies are included to demarcate various phases of the financial crisis. The events we use to split up our sample are, in order, the BNP Paribas announcement to freeze three investment funds, the buyout of Bear Stearns, the bankruptcy of Lehman Brothers, and the introduction by the Federal Reserve of interest payments on excess reserves (IOER) as excess reserves broadly increased.
All of these variables are positive and highly significant. The positive coefficient for GDP likely reflects that demand for commercial payments increases as the economy grows, holding the other regression variables constant. As expected, overall financial market activity, represented by the volume of trades on the NYSE, is highly correlated with payments transfers.
Interestingly, the positive coefficient for the Libor-OIS spread implies that increasingly illiquid financial market conditions are highly correlated with payments values. One possible explanation for this finding could be that during times of bank funding stress, banks and other market participants may be more forceful in demanding immediate payment to reduce counterparty exposures, rather than waiting to receive offsets later, resulting in larger payments values on average.
Furthermore, the size and sign of the coefficients for our period dummies are consistent with the striking up-and-down pattern of the series. The constant represents the average value of Fedwire payments before the start of the crisis (pre-BNP). Compared with precrisis, the post-BNP periods have larger average values of aggregate payments. In particular, the alternating magnitudes of the coefficients for the period dummies in the post-BNP periods capture the fluctuations of payments volumes, as the coefficient for the Bear-to-Lehman period is smaller than that for the BNP-to-Bear period, and the coefficient for the post-IOER period is smaller than that for the Lehman-to-IOER period. In summary, our R2 value indicates that our model captures 50.9 percent of the variation in payments.
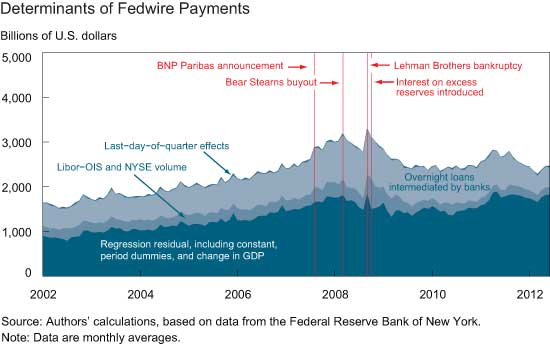
In the stacked-area chart below, we plot each variable’s contribution to the overall Fedwire series, so that the cumulative sum of the stacks yields the original Fedwire values. We multiply each regression coefficient by the values of its corresponding independent variable and add overnight loans. We observe that the bottom series, which includes the regression residual as well as the effect of the period dummies and the change in GDP, is indeed flatter than the raw Fedwire series, especially during the financial crisis; this illustrates that a large amount of variation in Fedwire payments values is accounted for by the other variables in the regression. Lastly, the monthly average of the last-day-of-quarter effects can be seen at the top of the chart.
Our results capture how a growing economy requires increasing levels of payments, and how in times of turmoil payments levels respond to growing demands for immediacy. Further exploration into these findings will shed light on how these variables relate.
Disclaimer
The views expressed in this post are those of the authors and do not necessarily reflect the position of the Federal Reserve Bank of New York or the Federal Reserve System. Any errors or omissions are the responsibility of the authors.

Parinitha Sastry is a senior research analyst in the New York Fed’s Research and Statistics Group.

David Skeie is a senior economist in the Research and Statistics Group.


 RSS Feed
 Follow Liberty Street Economics