Richard K. Crump, Stefano Eusepi, and Emanuel
Moench
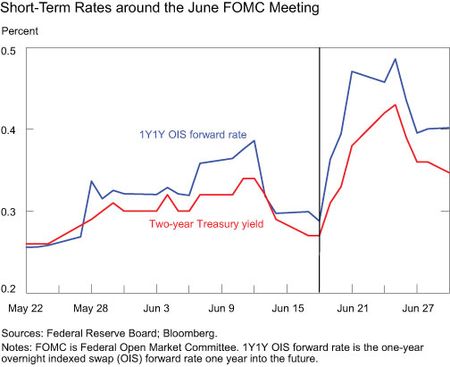
Following the June 18-19 Federal Open Market Committee (FOMC) meeting different measures of short-term interest rates increased notably. In the chart below, we plot two such measures: the two-year Treasury yield and the one-year overnight indexed swap (OIS) forward rate, one
year in the future. The vertical line indicates the final day of the June FOMC meeting. To what extent did this rise in rates following the June FOMC meeting reflect a shift in the expected future path of the federal funds rate (FFR)? Market participants and policy makers often directly read the expected path from financial market data such as the OIS contracts. In this post, we take an alternative approach by looking at surveys of professional forecasters to assess how expectations changed.
The advantage of market-based measures is that, unlike survey data, they are available at very high frequencies. However, changes in market- based measures of expectations may be obfuscated by significant changes in investors’ risk assessment—changes in so-called term premia (see this Liberty Street Economics blog post for more information on term premia). For example, the OIS is an agreement where one party pays a specified fixed interest rate payment in return for a floating interest rate payment based on the FFR. Movements in the OIS rate thus reflect changes in market participants’ expectations of the future evolution of the FFR as well as the compensation they require for bearing the risk that actual outcomes may be different from what they expect.
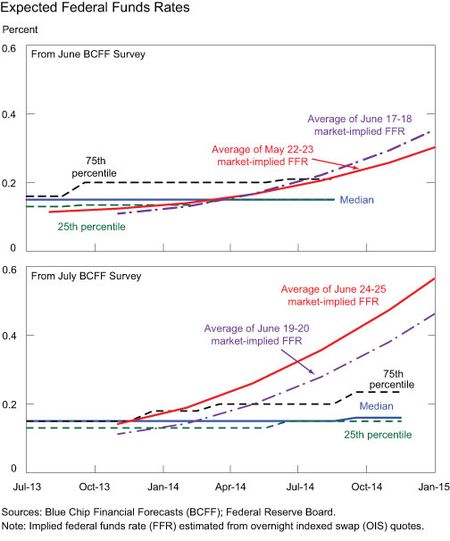
In the chart below we present two scenarios. The panel on the top gives the expected path of the FFR from the June Blue Chip Financial Forecasts (BCFF) survey (conducted on May 22-23) and the panel below gives the path from the July survey (conducted a few days after the June FOMC meeting, on June 24-25). The BCFF survey is a survey of forecasts on economic and financial indicators taken over a wide range of institutions
(for more details, see here). The solid blue line in each panel shows the median forecast for the horizons available in each survey (the July survey extended the horizon to the fourth quarter of 2014). Encasing the median forecast are the 25th and 75th percentile forecasts displayed as dotted black lines. None of these three series shows any meaningful changes after the June FOMC meeting. Solid red lines indicate the market-implied FFR path from OIS contracts observed on the same days as the surveys were conducted. While survey and financial market measures were basically
aligned before the FOMC meeting, the market-implied path shoots up in late June. For comparison, the majority of professional forecasters in the July survey do not expect the FFR to be above the range of 0 to 0.25 percent through the end of 2014. In contrast, the path of the red solid line is roughly consistent with the FFR leaving this range in mid-2014.
These findings may be only suggestive given the length of time between the June and July BCFF surveys. We deal with this drawback in two ways. First, we have included as dash-dotted purple lines the market-implied path right before and after the June FOMC meeting. The market-implied path right before the meeting is very similar to the average path observed on the June survey dates. The market-implied path right after the meeting shows that most of the adjustment to OIS rates occurred soon after the
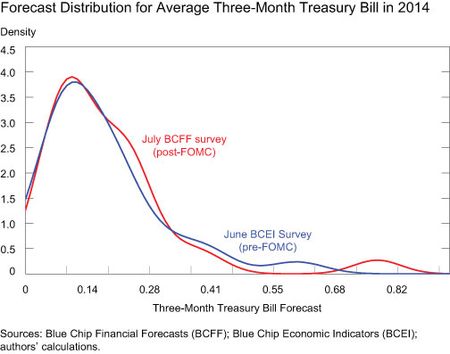
FOMC meeting. Second, we use information from the Blue Chip Economic Indicators (BCEI) survey. The June BCEI survey conducted on June 5-6 has twenty-eight participants in common with the July BCFF survey (approximately half of the respondents in each survey). This exercise
allows us to evaluate changes in survey forecasts in a narrower window around the June FOMC meeting (see this blog post for an example of this approach for the August 2011 FOMC meeting). We use forecasts of the three-month Treasury bill because the BCEI does not collect forecasts for the FFR. The three-month Treasury bill and the FFR typically move in lockstep.
The next chart shows two estimated distributions for the average level of the three-month Treasury bill for 2014. The blue and red solid lines display these estimated distributions across the twenty-eight forecasters in the surveys taken before and after the FOMC meeting, respectively. This plot shows that narrowing the window around the FOMC date does not alter the conclusions. There was almost no change between professional forecasts of short-term interest rates before and after the June FOMC meeting.
The main takeaway from our analysis is that professional forecasters did not interpret Fed communication around the FOMC meeting as signaling a change in the likely path for the FFR. Then how do we reconcile the fact that interest rates rose substantially, but professional forecasts showed little change? The most likely explanation is that the shift in interest rates was attributable to changes in term premia as investors shifted their risk assessment over this period. This interpretation is consistent with a
comparative historical analysis of this period posted on this blog.
Disclaimer
The views expressed in this post are those of the authors and do not necessarily reflect the position of the Federal Reserve Bank of New York or the Federal Reserve System. Any errors or omissions are the responsibility of the authors.

Richard K. Crump is a senior economist in the New York Fed’s Research and Statistics Group.


 RSS Feed
 Follow Liberty Street Economics