Rajashri Chakrabarti and Max Livingston
A key institution that was significantly affected by the Great Recession is the school system, which plays a crucial role in building human capital and shaping the country’s economic future. To prevent major cuts to education, the federal government allocated $100 billion to schools as part of the American Recovery and Reinvestment Act of 2009 (ARRA), commonly known as the stimulus package. However, the stimulus has wound down while many sectors of the economy are still struggling, leaving state and local governments with budget squeezes. In this post, we present some key findings on how school finances in New York State fared during this period, drawing on our recent study and a series of interactive graphics. As the stimulus ended, school district funding fell dramatically and districts across the state enacted significant cuts across the board, affecting not only noninstructional spending but also instructional spending—the category most closely related to student learning.
The bursting of the housing bubble and the onset of the recession in 2007 strained state and local government finances as their revenue streams dried up. Local governments are generally very dependent on property taxes for their funding; so as house prices fell, they faced declining revenue. State governments also saw a decline in funds due to lower income tax revenues as a result of the weak labor market and lower sales tax revenues from reduced consumption. As part of ARRA, New York received approximately $5.6 billion for its schools over the course of three years (see this 2012 article by Orr and Sporn for more on the Act). Districts were directed to use ARRA funds to save and create jobs, boost student achievement, and ensure transparency and accountability. New York spent most of its ARRA aid in the 2009-10 school year and a smaller but significant portion in 2010-11, with very little remaining after that.
To conduct our analysis, we use school district financial report data from the New York Office of the State Comptroller, which covers 696 school districts from 2005 through 2012 (for simplicity, from now on we’ll use the spring term to denote the school year). We use a trend-shift analysis to compare the gap between districts’ actual finances with where they would’ve been based on the prerecession trend, while controlling for school-district-fixed characteristics and other time-varying socioeconomic and demographic variables. For easier interpretation, we express this gap as a percentage of the prerecession value of the corresponding school finance indicator.
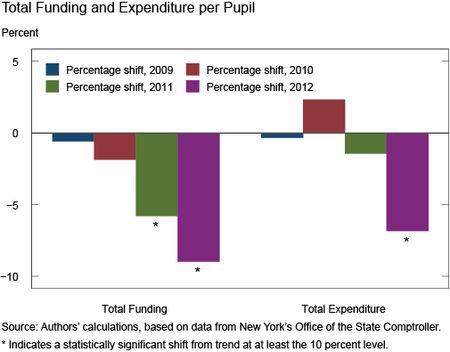
As the chart below shows, while per-pupil funding and expenditure remained on trend until 2010, they experienced statistically (and economically) significant declines in 2011 and 2012, with 2012 having the deepest cuts thus far.
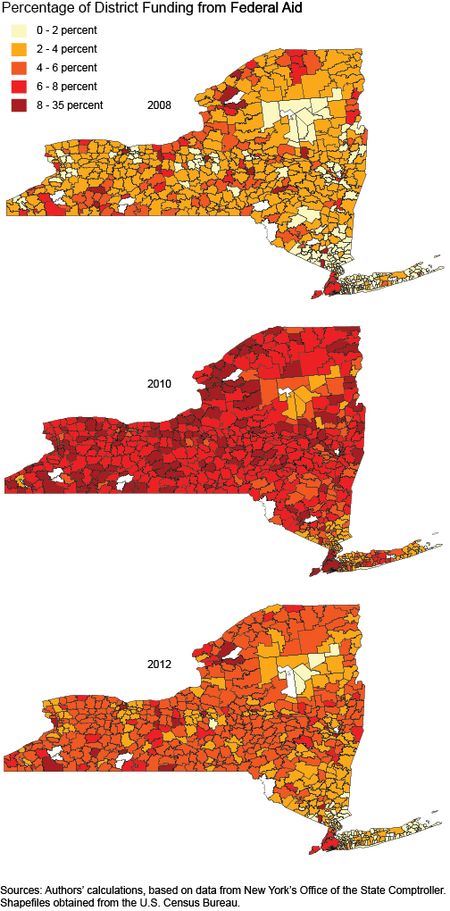
Digging further into the drivers of total funding, we examined the three primary components of district funding—federal aid, state aid, and local revenue. The state-wide increase in 2010 and subsequent decline in federal aid from the stimulus are clear from the maps below. (For a more detailed and comprehensive look at the spatial evolution of total funding, total expenditure, and their various components, see this series of interactive graphics.)
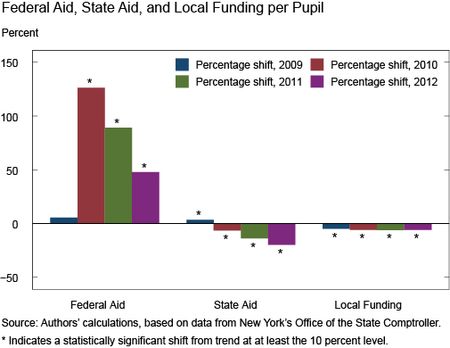
As New York received an influx of federal aid, it cut state aid to districts, as can be seen in the chart below. In the later years, federal aid fell with the drawdown of stimulus, but instead of making up for the balance, New York cut state aid further (relative to trend). Local revenue per pupil was slightly below trend in each year.
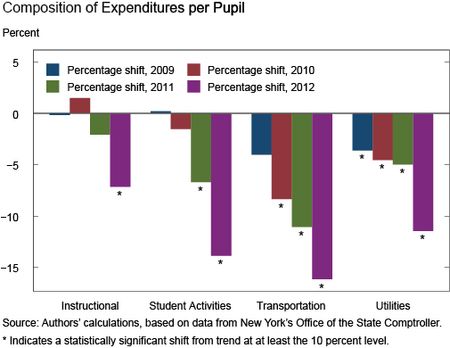
Next, we look at how districts changed the composition of their expenditure. Until 2012, there’s no evidence of any downward shift in instructional expenditure—the key expenditure category for student learning. In 2012, however, instructional expenditure sustained deep cuts, as seen in the next chart. Unlike instruction, noninstructional expenditure (such as utilities and transportation) shows declines even in the earlier years after recession. However, these declines were by far the most prominent in the later years, especially 2012. Student activities (such as extracurricular activities)—another category related to overall student development—were preserved in the first two years, then cut significantly in the latter two years. These patterns indicate that districts prioritized instructional expenditures by cutting noninstructional spending, but by 2012—with the drying up of stimulus funds and state and local revenue remaining significantly below trend—districts had no choice but to cut instructional spending as well.
By comparing New York district finances with our expectation based on earlier trends, we’re able to see that the fiscal situation of New York’s school districts has worsened in recent years. Clearly, the echoes and after-effects of the Great Recession are still being felt. Because of support from the federal government, school funding and expenditures weren’t immediately affected when the market crashed. But as that support waned and state funding fell further from trend, and as local governments were still in no position to boost their revenues, school districts began making significant cuts. By 2012, these cuts were no longer limited to noninstructional categories, but also hit instruction—the category most closely related to student learning and development. Of note is that in 2012, instructional expenditure sustained significant declines of approximately 7 percent from trend. As the economy improves, we expect that school district funding will also increase, but we don’t know what effect the multiyear cuts to instruction, student services, and student activities may have on the academic and overall development of students.
Disclaimer
The views expressed in this post are those of the authors and do not necessarily reflect the position of the Federal Reserve Bank of New York or the Federal Reserve System. Any errors or omissions are the responsibility of the authors.

Rajashri Chakrabarti is an economist in the Federal Reserve Bank of New York’s Research and Statistics Group.


 RSS Feed
 Follow Liberty Street Economics