Marc P. Giannoni and Hannah Herman
The Federal Reserve Reform Act of 1977 established the monetary policy objectives of maximum employment, stable prices, and moderate long-term interest rates. The goal of “stable prices” has long been understood to mean a low positive inflation rate. On January 25, 2012, the Federal Open Market Committee (FOMC) explicitly defined its price stability mandate in terms of a longer-run goal of 2 percent inflation measured by the total personal consumption expenditure (PCE) deflator. Here, we examine how the behavior of inflation over different time periods compares to this goal. We then discuss how the goal of stabilizing inflation over the long run, rather than on a year-after-year basis, tends to imply a stabilization of the U.S. price level around a trend line—an outcome similar to that from price-level targeting, which offers various theoretical benefits.
U.S. Prices since the Mid-1980s
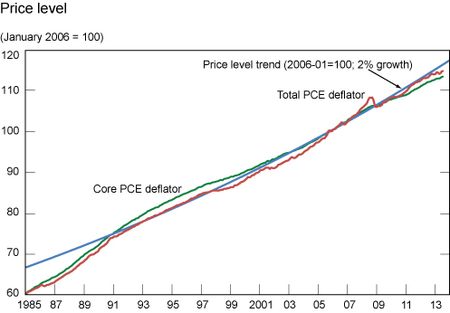
The chart below plots the monthly index of the total PCE deflator and the core PCE deflator (which excludes the volatile energy and food components), as well as a trend line that grows at a constant 2 percent annual rate. All three lines are normalized to 100 in January 2006, the start of Fed Chairman Ben Bernanke’s tenure.
Three features are noticeable from this chart. First, the total PCE deflator grew significantly faster than 2 percent per year before 1990. Indeed, while the inflation rate slowed from the double-digit numbers of the early 1980s following the Volcker disinflation, it still averaged 3.5 percent for the years 1985-90.
Second, the total PCE deflator has tracked the trend line fairly well since 1991, with an average year-over-year inflation rate of 2.06 percent.
Third, this series has at times displayed relatively large deviations from the trend line. Actually, the PCE deflator has been more than 2.0 percent below the trend line in early 2002 and June 2003, and as much as 2.7 percent above the trend line in July 2008. The low inflation registered in 2002-03, together with relatively weak economic conditions, prompted the FOMC to lower its key policy instrument—the target federal funds rate—to 1 percent. Conversely, the relatively rapid increase in PCE prices and robust economic activity in 2005-06 resulted in the FOMC repeatedly raising the federal funds rate. These deviations in the PCE deflator from the trend line were also due to rising energy prices, as indicated by the growing gaps between the total and core PCE deflators. However, between summer 2007 and summer 2008, the increase in energy prices was seen as largely temporary by the FOMC, and the gap closed quickly as energy prices collapsed in fall 2008. Energy and food prices rose again more rapidly than core prices in early 2011, the wake of the Arab Spring; after a temporary increase in inflation, the total PCE index stabilized again around the 2 percent trend line.
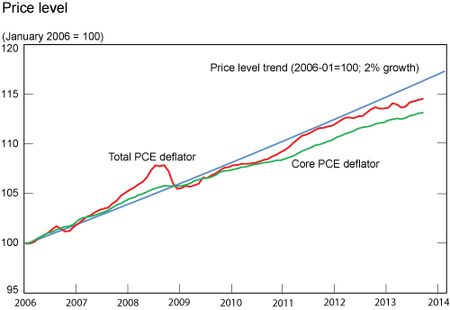
The next chart reproduces the same lines, focusing on the recent period that covers the tenure of Chairman Bernanke.
The period since January 2006 can be described as one of extreme economic volatility. However, in spite of a major financial crisis and the Great Recession, the average year-over-year growth rate of the total PCE deflator has been 1.95 percent—a number not far off from the FOMC’s longer-run inflation goal of 2 percent—despite concerns that the monetary stimulus put in place would create excessive inflation.
Thus, it seems that over the past seven-and-a-half years, the Fed has been relatively successful in returning the price level to a 2 percent trend line, much as it did over the prior fifteen years. One might ask how the Fed has achieved this. In part, the Fed benefitted from offsetting inflationary and deflationary shocks over this time period; but there is little doubt that monetary policy has played an instrumental role in returning the price level to this trend line. As previously mentioned, the relatively restrictive monetary policy in late 2005 and 2006 was bound to eventually bring the level of the total (and core) PCE deflators back to their long-run trend. Similarly, the extraordinary monetary policy stimulus (in the form of exceptionally low interest rates, forward guidance, and large-scale asset purchases) provided since the beginning of the recent financial crisis, has largely prevented the Great Recession from causing price deflation. For example, this paper by Del Negro, Giannoni, and Schorfheide argues that the remarkable stability in U.S. inflation in the face of a sharp economic contraction can be attributed to the fact that monetary policy focused on stabilizing inflation around its target.
Inflation or Price-Level Stabilization?
While the price level has remained remarkably close to its 2 percent trend line since the early 1990s, the total PCE deflator has been below this trend line since 2009 with a 1.4 percent gap in July 2013; the core index displays an even larger gap.
Should we expect this gap to be closed in the near future? The answer to the question depends on whether the Fed stabilizes inflation or the price level around its trend line. If the Fed aims to stabilize inflation each year at its target, one should expect the price level to continue to grow at 2 percent over the next few years but not return to the 2 percent trend line. By contrast, if the Fed aims to stabilize the price level, a return to the trend line would be more likely; however, this would require the Fed to tolerate inflation temporarily higher than 2 percent to make up for the present shortfall.
One way to determine whether the Fed has been stabilizing inflation or the price level around a long-run trend line is to estimate the actual historical behavior of the FOMC. It is common to describe the FOMC’s setting of the federal funds rate with an interest-rate rule (often called a Taylor-type rule) in which the federal funds rate depends on deviations of the inflation rate from 2 percent, on GDP growth, and on the past level of the federal funds rate. When the dependence on the past interest rate is sufficiently high (that is, when the degree of interest rate inertia is close to one), then the central bank’s interest-rate policy approximately stabilizes the price level around a trend line. (See the technical appendix for further details.) Typical estimates of interest-rate inertia in the United States are lower than one, but not much so, implying that the Fed’s historical policy has been quite similar to price-level targeting.
Moreover, while the FOMC has stated its policy strategy in terms of an inflation rate and not the price level, it is interesting to note that there is a technical equivalence between the Fed’s “longer-run inflation goal” of 2 percent and price-level targeting. (The technical appendix also discusses this point.) As such, if the FOMC’s past behavior continues, it is reasonable to expect inflation tempora
rily higher than 2 percent so that the price level will return to its long-run trend line.
Finally, the threshold-based policy first announced in December 2012—according to which the FOMC would maintain the target federal funds rate near zero as long as the unemployment rate remains above 6.5 percent, even if inflation projections between one and two years ahead would be slightly above 2 percent—is in fact consistent with the FOMC’s commitment to a longer-run inflation goal of 2 percent and a policy of price-level stabilization.
Is It Desirable to Stabilize the Price Level?
Several academic papers (including this one by one of this post’s authors) have argued that a commitment by the central bank to stabilizing the price level around a 2 percent trend line has a number of advantages. As unexpected surprises in inflation must be offset by future monetary policy to stabilize the price level under such a regime, households and firms should find it easier to forecast prices several years down the road, and long-run inflation expectations should remain more firmly anchored around the long-run inflation goal. Moreover, firms should be reluctant to fully adjust their prices to surprise changes in their costs, as they would likely anticipate these cost changes to be reversed in the future. The benefits of price-level targeting are likely to be particularly important when the short-term policy rate is constrained by the so-called zero bound, as explained in this paper by Eggertsson and Woodford.
Conclusion
Since the early 1990s, the PCE deflator has remained remarkably close to a 2 percent trend line. It has continued to track this trend since the beginning of Chairman Bernanke’s tenure in January 2006, despite a dramatic financial crisis and the Great Recession. By committing to stabilizing inflation over the long run, the FOMC is de facto at least partially stabilizing the price level around a trend line. Such a policy should thus reap some of the benefits of price-level targeting.
Disclaimer
The views expressed in this post are those of the authors and do not necessarily reflect the position of the Federal Reserve Bank of New York or the Federal Reserve System. Any errors or omissions are the responsibility of the authors.

Marc P. Giannoni is an officer in the Federal Reserve Bank of New York’s Research and Statistics Group.


 RSS Feed
 Follow Liberty Street Economics
Hi, your post shows clearly that the Fed under Bernanke is failing on the “price stability” half of the mandate in undershooting the price level trend. Thanks for letting us know. Can you now do a post showing how well Bernanke’s Fed has fared on the “full employment” half of the dual mandate? I presume the Fed is doing much better on that score?