Olivier Armantier, Giorgio Topa, Wilbert van der Klaauw, and Basit Zafar
Note: We aren’t releasing the underlying data yet, but we’ll be making them available to the public sometime in first-quarter 2014. So please stay tuned.
In the previous two blog postings in this series, we described the goals, structure, and content of the new FRBNY Survey of Consumer Expectations (SCE) and presented some findings regarding inflation expectations. In this third posting, we focus on the labor market component of the SCE.
The survey’s monthly core module contains questions regarding respondents’ current labor force status, including self-employment. In addition, for those currently employed, we elicit year-ahead expectations of earnings growth, of the likelihood of voluntary separations (quits) and involuntary separations (layoffs), and of the likelihood of finding and accepting a job within three months if the individual were to lose it today. Respondents are also asked about the likelihood of their moving to a different primary residence in the next year.
Taken together, responses to these questions yield new quantitative measures that enable us to gauge households’ perceptions of prospective labor market conditions—perceptions that are likely to affect job search behavior and labor market outcomes. In addition, high-frequency data on wage growth expectations can provide important new insights. Like inflation expectations, wage expectations affect consumer intertemporal decisions, and are therefore of great value for understanding and forecasting economic behavior. Moreover, since price-setting behavior by firms is at least partly dependent on wage demands, expected wage dynamics may be an important determinant of actual and expected inflation.
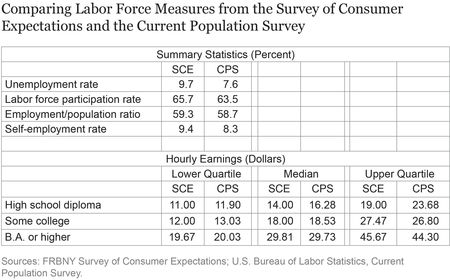
The labor force status questions enable us to compute various summary statistics of the labor market that we can compare with the corresponding U.S. Bureau of Labor Statistics (BLS) measures in the Current Population Survey (CPS). As shown in the top panel of the table below (based on data from June 2013), SCE statistics match CPS measures for the unemployment rate, labor force participation rate, employment/population ratio, and self-employment rate quite well, considering the relatively small number of observations in the SCE compared with the CPS. Further, the distribution of self-reported hourly earnings by educational attainment—shown in the bottom panel of the table—is very consistent with the corresponding numbers in the CPS, at all quartiles of the distribution.
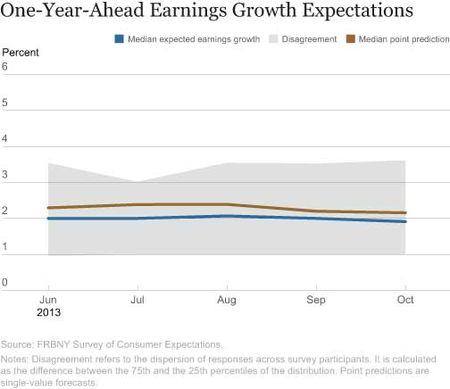
We ask employed respondents for their (nominal) earnings expectations, conditional on working in the same job at the same place they currently work and for the same number of hours. We use the same density elicitation format that we employ for inflation and house price expectations, which provides us with rich information on the percent chance that respondents assign to various possible outcomes for their wage earnings. The chart below shows the median expected rate of earnings growth (density mean) for all employed workers: this measure of expected earnings growth has been hovering around 2 percent per year, a figure in line with recent BLS data on actual changes in wages and salaries from the Employment Cost Index. The shaded band gives a sense of the distribution of expectations across survey respondents: the interquartile range, which covers the middle 50 percent of the distribution of responses, goes from about 1 percent to about 3.5 percent expected wage growth. Finally, we also ask respondents for a point prediction—a single-value forecast—of future earnings. The median point prediction, also shown in the chart, behaves qualitatively very similarly to our median expected rate of earnings growth.
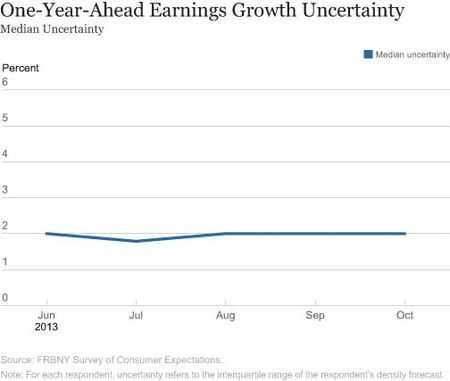
As depicted in the chart below, median uncertainty about future wage growth has also been stable at around 2 percent over the past few months. Wage growth uncertainty is lower than uncertainty regarding overall inflation and house price changes, perhaps reflecting the fact that respondents tend to have a better idea of their own future wage and salary prospects than of overall inflation or the housing market.
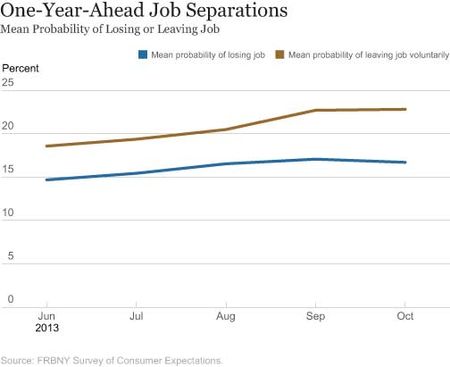
We next look at expectations concerning quits and layoffs. The chart below shows that the mean percent chance assigned to the possibility of losing one’s job over the next twelve months has been fairly stable at around 16 percent over the past few months, while the percent chance of leaving one’s job voluntarily over the same horizon has risen slightly from 19 percent to 23 percent. These expectations are slightly higher but roughly in line with historical data for the quits rate and the layoff and discharges rate from the Job Openings and Labor Turnover Survey (JOLTS) run by the Bureau of Labor Statistics. Typically, quits rise during recoveries as workers perceive better prospects for changing jobs, so these expectations are a moderately encouraging sign for the labor market.
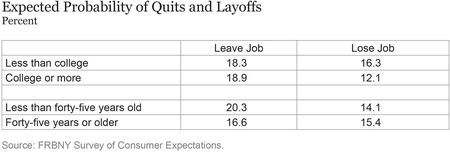
Expectations of quits and layoffs also exhibit interesting variation across demographic groups, as shown in the next table using data from the June SCE only. The expected probability of being laid off is higher for less educated workers, whereas the expected probability of leaving one’s job voluntarily is higher for younger workers. This is consistent with the observation that younger workers tend to be more mobile, while less educated workers are more exposed to the risk of layoffs and discharges.
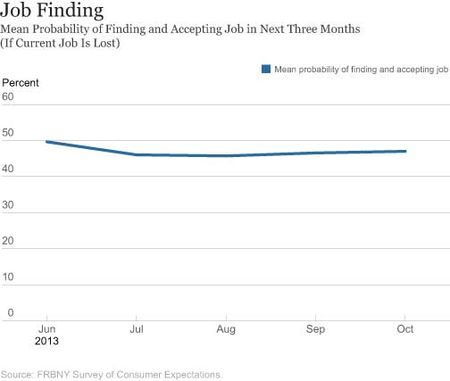
The next chart focuses on the expected
probability of finding and accepting a new job within three months, if the respondent were to lose his or her current job. This is another indicator of the health of the labor market: the job-finding rate typically rises as job openings increase relative to the number of job seekers, and is considered one of the main drivers of fluctuations in employment and unemployment. The chart shows that the expected percent chance of finding and accepting a new job has been rising very slightly over the last few months after a drop in July. Its level, at around 46 percent, is again roughly in line with actual CPS data over the past year.
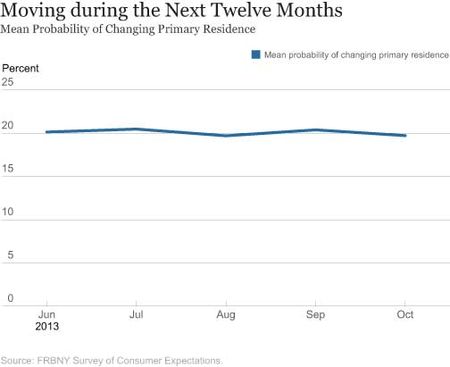
Finally, we show in the chart below the mean percent chance that respondents assign to the possibility of moving to a different primary residence over the next twelve months. On average, SCE respondents report an 18 percent probability of moving, and this expectation has been fairly flat over the past few months.
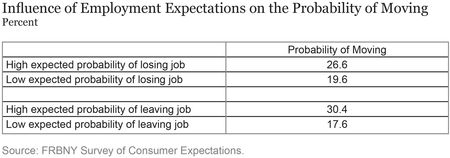
We may expect this measure to be influenced by various factors, including demographic shifts and varying conditions in the labor and housing markets. As the table below shows, the expected probability of changing primary residence is related in a meaningful way to respondents’ perceived likelihood of leaving or losing their current job.
Disclaimer
The views expressed in this post are those of the authors and do not necessarily reflect the position of the Federal Reserve Bank of New York or the Federal Reserve System. Any errors or omissions are the responsibility of the authors.

Olivier Armantier is an assistant vice president in the Federal Reserve Bank of New York’s Research and Statistics Group.

Giorgio Topa is a vice president in the Research and Statistics Group.

Wilbert van der Klaauw is a senior vice president in the Research and Statistics Group.

Basit Zafar is a senior economist in the Research and Statistics Group.


 RSS Feed
 Follow Liberty Street Economics