Olivier Armantier, Giorgio Topa, Wilbert van der Klaauw, and Basit Zafar
Note: We aren’t releasing the underlying data yet, but we’ll be making them available to the public sometime in first-quarter 2014. So please stay tuned.
In this second of a series of four blog postings, we discuss the data on inflation expectations collected in our new FRBNY Survey of Consumer Expectations (SCE). Inflation expectations are a key consideration for monetary policy as they are believed to influence consumer behavior, thereby affecting economic activity and actual inflation. The SCE data on inflation expectations represent a major innovation as they contain information not previously collected from consumers on a regular basis. In this post, we provide some background on the survey and present some initial findings.
Starting with our question on overall inflation, we ask respondents directly about “the rate of inflation” (or “deflation”). In our previous research, we have found that the vast majority of respondents have a basic understanding of the concept of inflation and are able to express their views of inflation in quantitative terms. We therefore ask respondents directly for their expectations about the “rate of inflation” and do so for two different horizons: a short term (one-year ahead) and medium term (three-year ahead).
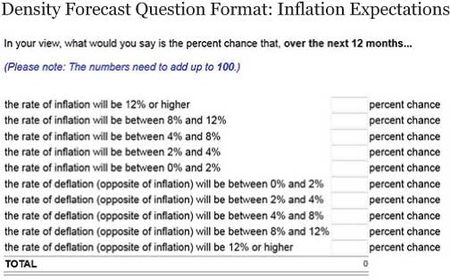
As mentioned in the previous blog post in this series, an important innovation of our survey is that, in addition to using traditional point forecasts, we also measure inflation expectations using density forecasts, where participants are asked to assign probabilities to intervals of future inflation outcomes. More specifically, respondents are asked for the percent chance that, over the next twelve months, the rate of inflation (or deflation) will be 12 percent or higher; between 8 percent and 12 percent; between 4 percent and 8 percent; between 2 percent and 4 percent; or between 0 percent and 2 percent.
As in earlier surveys, we find item response rates of over 95 percent to this question, with probabilities adding up to 100 percent in almost all cases.
We ask a similar question about three-year-ahead inflation, with respondents in the October survey being asked about the rate of inflation over the twelve-month period between October 2015 and October 2016. For each density forecast solicited this way, we subsequently compute the respondent’s density-based expected rate of inflation, which is the mean of their density, and the respondent’s inflation forecast uncertainty measured by their density’s interquartile range. The collection of real-time information on consumers’ uncertainty about future inflation outcomes is new and important, not only for forecasting future inflation and other macroeconomic outcomes, but also for assessing the effectiveness of central bank communication.
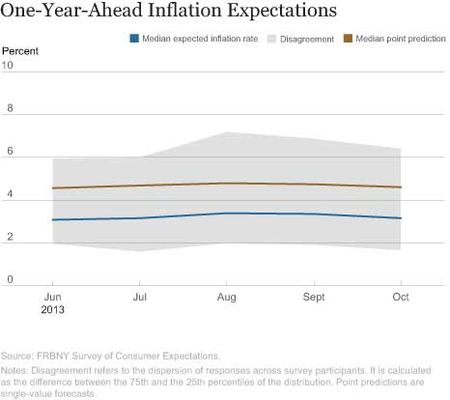
The chart below presents the median across respondents’ one-year-ahead expected rates of inflation (density means), with the shaded area representing the interquartile range (values between the twenty-fifth and seventy-fifth percentiles of the distribution of density means across respondents). The distance between these two quartiles represents a measure of disagreement across respondents. The chart indicates that the median expected rate of inflation has remained relatively stable staying within a 3.1 percent to 3.4 percent range, increasing slightly between June and August and falling marginally in October. Disagreement shows a trend similar to the median expected rate of inflation.
Also shown in the same chart is the median of respondents’ point predictions of year-ahead inflation which tends to be quite a bit higher than the median expected rate of inflation derived from density data. The two measures move together and, for most respondents, the point prediction and the density mean are very similar. However, for some (as is the case for respondents to the Survey of Professional Forecasters), there is a gap between the two, with the point forecast typically exceeding the respondent’s density-based expected rate of inflation. An important advantage of density forecasts over point predictions is that the former allow interpersonal comparisons, whereas with the latter it is not clear what measure of central tendency is being used, with some people reporting the mean, and others the median or the mode.
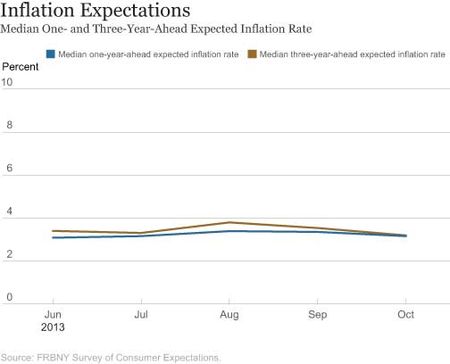
The next chart shows the median of respondents’ density-based expected rates of inflation over one- and three-year horizons. During the past few months, both have moved together closely, with the median three-year-ahead expected rate of inflation slightly exceeding that of one-year-ahead inflation.
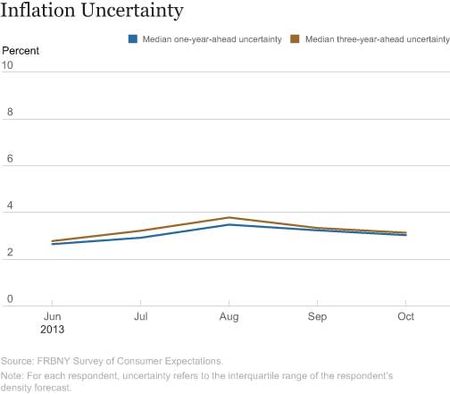
Turning next to respondents’ uncertainty about inflation, the chart below reports the median across respondents of the density interquartile range with a higher value reflecting greater uncertainty. Median inflation uncertainty has been stable over both short-term and medium-term horizons with that for the medium term persistently slightly higher than for the short term.
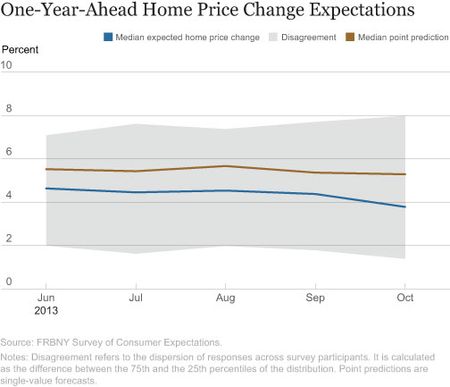
Another focus of our survey is expectations of home price changes. Similar to our questions about inflation, we ask respondents for their density and point forecasts of year-ahead changes in the average home price nationwide. The next chart shows that after reaching 5 percent in August, the median of the density-based expected increase in the average home price fell to 3.8 percent in October. There was a notable decline in the 25th percentile of expectations. As with overall inflation, the median point forecast exceeds
the median density-based expectation with both measures moving together over time. Finally, the median level of uncertainty about year-ahead average home price changes (not shown) has been relatively stable over the past five months.
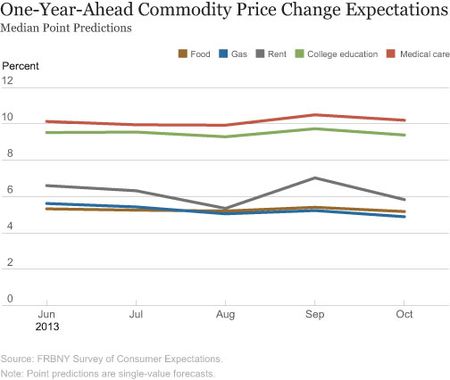
We also asked respondents for their point predictions of year-ahead changes in the price of several commodities. Tracking specific price expectations can help in explaining changes in overall inflation expectations, as was the case in March 2011 when a spike in expected short-term inflation coincided with a temporary surge in gasoline and food price expectations.
The next chart shows the median point prediction across respondents for changes in food and gas prices. Also shown are median point predictions for changes in the price of medical care, the cost of a college education, and the cost of renting a home. While the median forecast for food price inflation has been stable around 5.3 percent, the one for gas price inflation has fallen gradually from 5.7 percent in June to 5.0 percent in October. The median forecast for home rental cost has fluctuated around an average increase of 6 percent during the period, while those for medical care and a college education have remained fairly stable around annual increases of 10.2 percent and 9.5 percent, respectively.
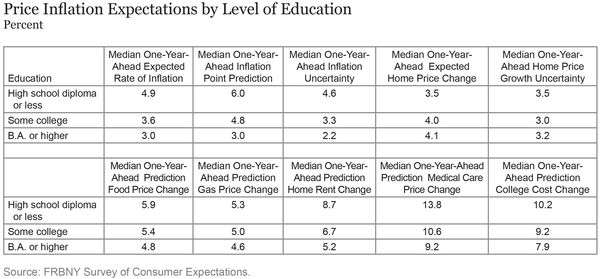
The trends in median point forecasts shown above conceal substantial and interesting heterogeneity across respondents. The table below, based on the October SCE survey, reports forecasts of overall and specific price inflation, by the respondent’s level of education. We find a general pattern of higher price inflation expectations and higher inflation uncertainty among those with less education. (The only exception is for home price expectations, which are slightly increasing as education level rises.) We find similar results when looking at lower numeracy skills and lower household income levels. In our monthly releases of SCE findings, we will show trends separately by a number of respondent characteristics: age, household income, education, numeracy skills, and census region of residence. This distinction will enable the reader to assess how broad-based the observed trends are and whether these are driven by any specific demographic groups.
In our next blog, we will focus on the labor market component of the SCE, including expectations about wage earnings and various employment prospects.
Disclaimer
The views expressed in this post are those of the authors and do not necessarily reflect the position of the Federal Reserve Bank of New York or the Federal Reserve System. Any errors or omissions are the responsibility of the authors.

Olivier Armantier is an assistant vice president in the Federal Reserve Bank of New York’s Research and Statistics Group.

Giorgio Topa is a vice president in the Research and Statistics Group.

Wilbert van der Klaauw is a senior vice president in the Research and Statistics Group.

Basit Zafar is a senior economist in the Research and Statistics Group.


 RSS Feed
 Follow Liberty Street Economics