Thomas Klitgaard and Richard Peck
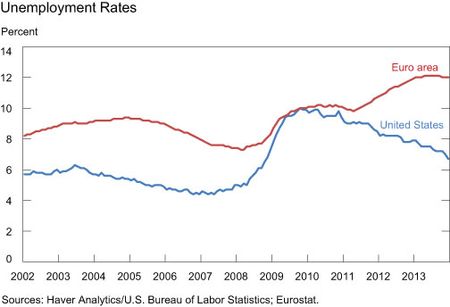
Euro area growth has been stalled since 2010, mired in the sovereign debt crisis, while the United States has managed a slow but steady recovery following the Great Recession. Euro area and U.S. labor markets reflect these differing growth paths. While unemployment rates in the euro area and the United States were both around 10 percent in 2010, the unemployment rate in the euro area has since increased to 12.0 percent, and the U.S. rate has fallen to 6.7 percent. However, the outperformance of the U.S. labor market as measured by unemployment rates is overstated. Employment relative to the population has declined in the euro area, but the divergence of this measure from that of the United States is more modest than suggested by unemployment rates. The difference is that, unlike in the United States, the share of women in the euro area labor force is increasing, and that development accounts for roughly half of the current gap between unemployment rates in the two economies.
The unemployment rate is the number of people unemployed divided by the labor force, which is the number of people either employed or unemployed and searching for work. The chart below shows that U.S. unemployment rate rose more sharply than in the euro area after 2007 and that the rates had converged by 2010. Since then, the euro area unemployment rate has pushed higher while the U.S. rate has fallen considerably, widening the gap to over 5 percentage points.
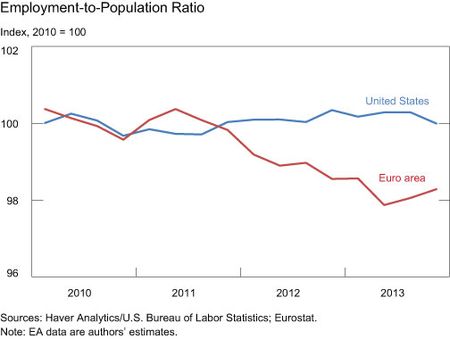
An alternative measure of the labor market, the employment-to-population ratio, tells a somewhat different story. This ratio, seen in the chart below, is calculated as the number of people employed divided by the number of people above the age of 16 (15 in the euro area). Note that, unlike the unemployment rate, the employment-to-population ratio does not reflect changes in the number of people reporting that they are searching for work. The ratios are indexed in the chart so that the average for 2010 for each series is equal to 100 to reveal the relative magnitude of recent changes in the ratio. (The U.S. ratio was 7.1 percentage points above the euro area ratio in 2010.) The chart below shows that the employment-to-population ratio deteriorated in the euro area and remained largely unchanged in the United States. This measure of the labor markets does not exhibit any of the gains suggested by the U.S. unemployment rate, with employment only growing in line with the population.
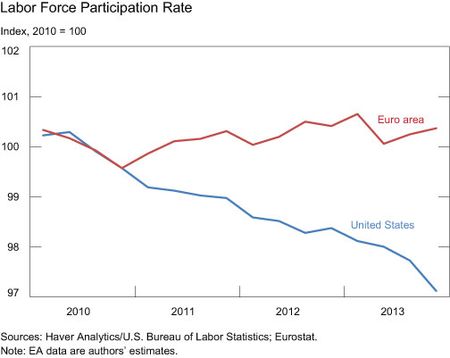
The difference between the stories told by these two measures can be explained by the divergence in the share of the population that is in the labor force. The chart below plots the labor force participation rate—the number of people working or searching for work divided by the total population. Again, we index both series to equal 100 in 2010. The labor force participation rate has fallen in the United States and stayed largely unchanged in the euro area. The drop in labor force participation in the United States has accentuated the fall in the U.S. unemployment rate and widened the gap between the unemployment rates of the two economies. If the euro area had seen a drop in the labor force participation rate proportional to the decline experienced by the United States, its unemployment rate would be about 9.5 percent, below where it was at the beginning of the sovereign debt crisis. Thus, roughly half of the difference in the unemployment rates is due to divergent trends in labor force participation over the last three years.
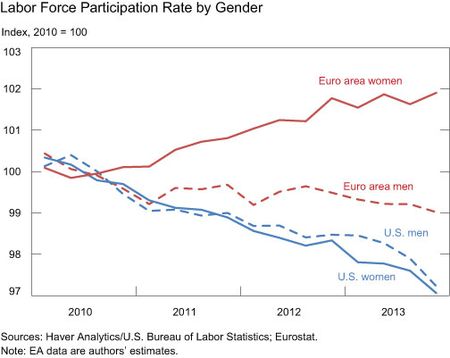
A breakdown of labor force participation by gender in the chart below illustrates the source of the divergence. Rates for men are plotted with dotted lines, and rates for women are plotted with solid lines. Euro area women are the outliers. Their labor force participation rate is about 2 percent above the 2010 level, unlike the rates for American men and women which have all declined and the rate for euro area men which has been relatively flat.
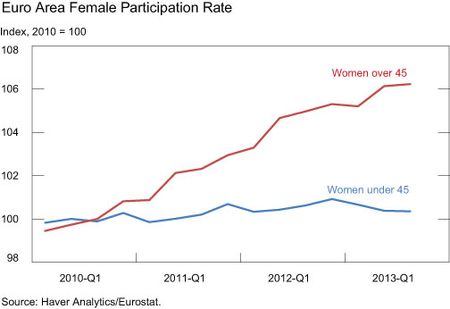
The chart below breaks down labor force participation for euro area women by age. It turns out that women over 45 accounted for almost all of the overall increase since 2010.
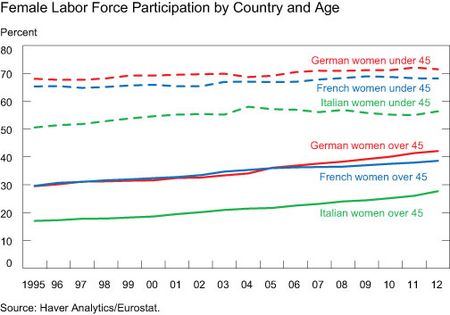
The upward trend in the share of over-45 women in the labor force is evident in the all three of the largest euro area economies. The chart below displays the labor force participation rates for younger and older women in Germany, France, and Italy (not indexed). There has been little change in labor force participation for younger women in the three countries over the past decade, while the growing participation rates for older women are similar across the three countries despite differences in labor market structures and business cycle dynamics.
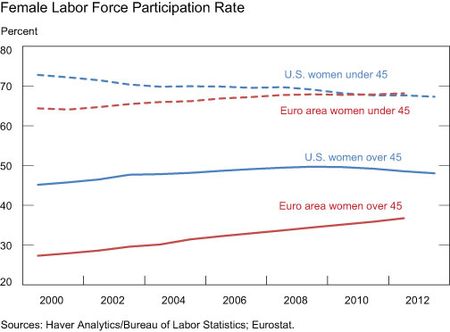
There is reason to expect the labor force participation rate in the euro area to continue to move higher, making it more difficult for the unemployment rate to fall as the euro area recovers. The chart below shows that the share of over-45 euro area women in the labor force is still much lower than the rate for U.S. women, but that the gap for the under-45 population has disappeared in r
ecent years. As a consequence, the female labor force participation rate in the euro area looks set to rise as the younger cohort ages, bringing the euro area over-45 rate closer to the U.S. rate.
The convergence of female labor force participation rates in the United States and the euro area will make comparison of unemployment rates across the two economies tricky going forward. Just as a declining labor force has put downward pressure on the U.S. unemployment rate, increasing labor force participation will put upward pressure on the euro area rate, making the labor market look less healthy than other indicators might suggest.
Disclaimer
The views expressed in this post are those of the authors and do not necessarily reflect the position of the Federal Reserve Bank of New York or the Federal Reserve System. Any errors or omissions are the responsibility of the authors.

Thomas Klitgaard is a vice president in the Federal Reserve Bank of New York’s Research and Statistics Group.



 RSS Feed
 Follow Liberty Street Economics