Nicola Cetorelli, Linda S. Goldberg, and Arun Gupta
This post is the seventh in a series of thirteen Liberty Street Economics posts on Large and Complex Banks. For more on this topic, see this special issue of the Economic Policy Review.
Paraphrasing a famous Supreme Court opinion: “I know bank complexity when I see it.” This expression probably speaks to the truth that, if we look at a given banking organization, we ought to be able to state whether it is more or less “complex.” And yet, such an approach hardly offers any guidance if one wants to understand the intricacies of global banks and to monitor and regulate them. What should be the appropriate metrics? It seems to us that there is not a consensus just yet on what complexity might mean in the context of banking. The global dimension of a bank adds many layers, so focusing on global banks is bound to yield a more comprehensive take on the issue than examining purely domestic banking entities. Therefore, in this piece, we view complexity through the lens of the operations of global banks.
In our recent research, we focus on three broad measures. The first is “organizational” complexity, indicating to what degree the organization is made up of separate affiliated entities. This concept is separate from what we define as “business” complexity, which refers to the type and variety of activities that are conducted within the walls of a given entity. Both are relevant concepts. Organizational complexity seems to fit more with concerns surrounding resolution, fragmentation, cross-border systemic risk, internal liquidity dynamics, managerial agency frictions, and “too big to fail.” Business complexity concepts may speak more to the diversification and fragmentation of the type of production that is undertaken by organizations, with concerns surrounding efficiency. The third metric, “geographic” complexity, overlaps with both organizational and business complexity concerns, and refers to the dispersion of affiliated entities across borders internationally.
How Much Complexity Is There?
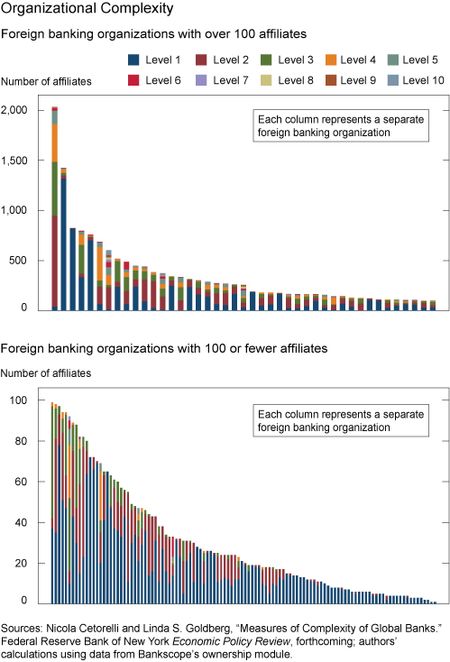
It turns out that measuring the organizational complexity of global bank organizations is pretty involved. Taking the set of all global bank organizations with a presence in the United States via bank branches (see chart below), let’s first consider the patterns in total counts of worldwide affiliates, our broadest form of organizational complexity. Typically, such counts are limited to the so-called Level 1 affiliates, that is, those directly owned by the ultimate parent of an organization (as done by Herring and Carmassi (2010)). However, limiting the analysis to Level 1 affiliates masks the full picture of the richness and diversity of affiliate structures, where ownership and control extend to many layers of nested entities, like very sophisticated Russian matryoshka dolls. The existence of affiliates beyond Level 1 complicates resolution and compounds agency frictions within the organizational hierarchy. We consider up to ten levels of ownership or nesting to provide perspective.
Level 1 affiliates are most common at banks having fewer than 100 affiliates, but even these less complex organizations often appear quite different as Levels 2 through 4 are added to the organizational structure. The complexity of the organizations is far greater for the group of “highholders” (ultimate parents) depicted in the top panel. Among them, 18 parents have over 250 affiliates, 7 have over 500 affiliates, and the largest one has 2,009 affiliates. The color coding shows that consideration of the Level 1 affiliates (in blue) would only capture a small fraction of affiliates for many of these large players. Overall, there are more than 7,000 Level 1 affiliates, 3,000 Level 2 affiliates, and 2,000 Level 3 affiliates, so that the total affiliates across these three levels and through Level 10 are well in excess of 15,000 for the 200-plus foreign parents in the United States in 2012.
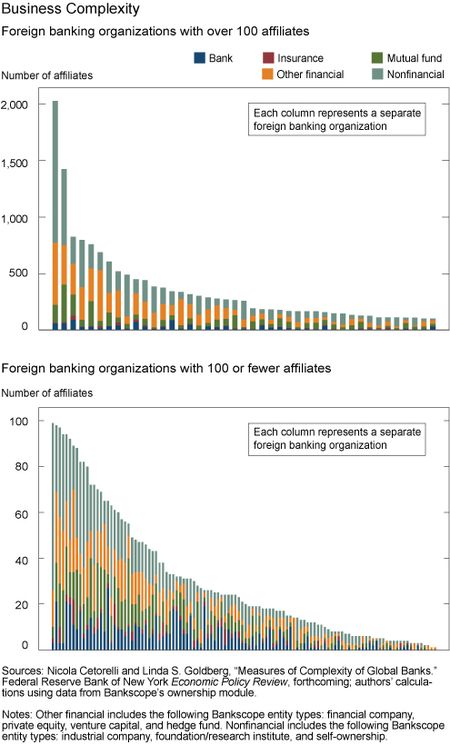
Besides raw counts, additional dimensions can offer a deeper understanding of the organizational complexity of global banks. So, for instance, for a given degree of organizational complexity, global banks tend to span a wide range of industry types, reflecting business complexity. Our data distinguish among five such types: banks, insurance companies, mutual funds, other financial entities, and nonfinancial entities. The chart below shows the count measure incorporating this industry breakdown. The data indicate, for instance, that insurance companies are the least common at each level, followed by banks, and then mutual funds. The counts of nonfinancial affiliates are generally many times the counts of banks. By our calculations, the median ratio of nonfinancial to bank affiliates across the smaller organizations (of fewer than 100 affiliates) is 3.5 while the median ratio across the larger organizations (of greater than 100 affiliates) is 17.
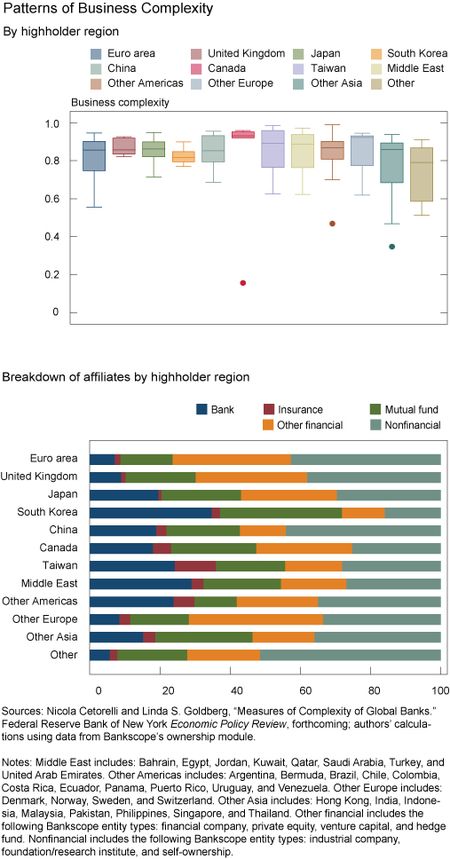
Business complexity can also be gauged by a Herfindahl-type index that is 0 for organizations exclusively comprising commercial banks and approaching 1 for organizations that hold each business type in roughly equal proportions. As shown in the chart below, Canadian banks appear to be most evenly distributed across types of affiliates. The median amount of business complexity is lower but similar for global financial organizations from China and the euro area. Moreover, both Chinese and euro area parent banks have nonfinancial entities making up more than 40 percent of their affiliates. Still, the Chinese organizations have proportionately more banks and mutual funds, while the euro area entities have larger shares of other financial firms.
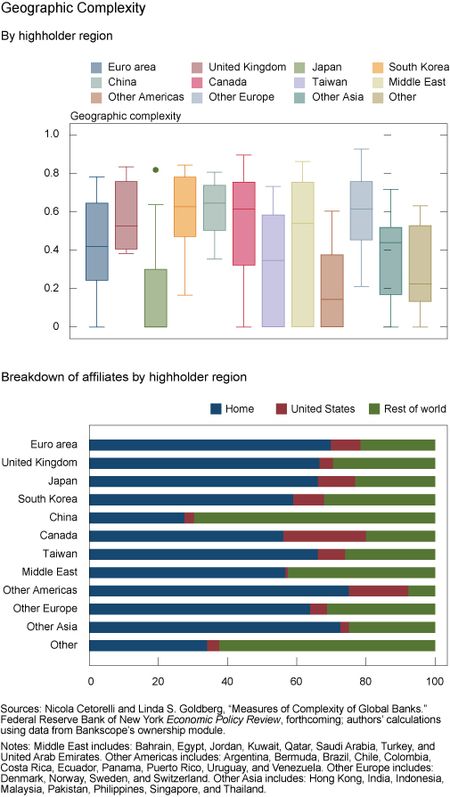
The location of the affiliates of each parent organization is another dimension that adds to a deeper understanding of global bank complexity. As illustrated in the chart below, there are very large differences in the patterns of geographic complexity. For example, global banking organizations with Japanese parentage are among the least geographically diverse in terms of the average affiliate structure, while also having lower overall numbers of affiliates per organization. By contrast, the euro area organizations are large in number, large in average numbers of affiliates, and high and quite differentiated in terms of geographic diversity of affiliates. The U.K. organizations are fewer in number, but also with large numbers of affiliates and high geographic diversity of these affiliates. Global banks are, thus, not equally global in outreach, and must be analyzed on a more detailed basis.
As a final point, there is a widespread perception that the size of organizations is closely mapped to the complexity of organizations. There is some truth to this, as larger organizations do tend to have greater numbers of affiliates, especially when considering the largest financial institutions. However, it is not the case that this tight link appears with respect to the other measures of complexity that we have described. Despite some positive correlations in the data, there are large distinctions across organizations in business, organizational, and geographic complexity at any given size of the parent organization. In those cases, the positive and negative consequences of complexity would need to be addressed by different means than initiatives aimed at organizational size.
Disclaimer
The views expressed in this post are those of the authors and do not necessarily reflect the position of the Federal Reserve Bank of New York or the Federal Reserve System. Any errors or omissions are the responsibility of the authors.

Nicola Cetorelli is an assistant vice president in the Federal Reserve Bank of New York’s Research and Statistics Group.

Linda S. Goldberg is a vice president in the Group.


 RSS Feed
 Follow Liberty Street Economics