Jan J.J. Groen and Richard Peck
The global sell-off last May of emerging market equities and currencies of countries with high interest rates (“carry-trade” currencies) has been attributed to changes in the outlook for U.S. monetary policy, since the sell-off took place immediately following Chairman Bernanke’s May 22 comments concerning the future of the Fed’s asset purchase programs. In this post, we look back at global asset market developments over the past summer, and measure how changes in global risk aversion affected the values of carry-trade currencies and emerging market equities between May and September of last year. We find that the initial signal of a possible change in U.S. monetary policy coincided with an increase in global risk aversion, which put downward pressure on global asset prices.
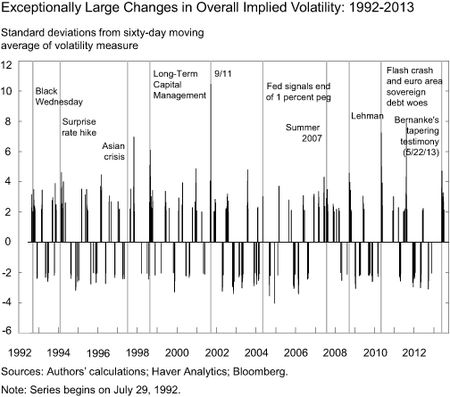
Implied volatility measures across different assets reflect, among other factors, market participants’ views on risk. Therefore, we conjecture that shifts in their risk aversion coincide with exceptionally large changes in implied volatility measures. An “exceptionally large” change in this case is defined as when overall implied volatility is at least two standard deviations above or below its mean over the previous sixty days. (“Overall implied volatility” is constructed as the average of the VIX index for U.S. equities, the Merrill Lynch Option Volatility Estimate [MOVE] Index for U.S. Treasury bonds, and the J.P. Morgan Global FX Volatility Index.) The chart below depicts changes in overall implied volatility for daily data from 1992 to September 2013, with labels for some key events that caused market turmoil. Exceptional volatility changes often occur in conjunction with these events, suggesting that these volatility changes are positively correlated with changes in (unobserved) risk aversion.
How do we then identify shocks to risk aversion? Correlations across different asset markets and across different regions tend to change over time. Anecdotal market participants’ commentaries often attribute these shifts in cross-asset correlations to what is known as “risk on-risk off” investment switches: When investors seek more risk, they tend to invest more in riskier assets, whereas if they become more risk averse they often withdraw funds en masse from riskier assets, causing increased cross-asset correlations.
We use the features described above to estimate the impact of changes in risk aversion on asset prices using a statistical model estimated with data for United States, euro area, Japanese and emerging market equity markets, the U.S. and euro area bond markets, commodities, and two U.S. dollar-based currency variables (which we explain in more detail below). In this model, the current changes in the values of these assets are regressed on past changes in the values of all the assets, with the changes not explained being “residuals.” By looking at shifts in the correlations across the model’s residuals when there are large changes in overall implied volatility, we can identify the appropriate linear combination of these residuals in order to estimate risk-aversion shocks. We implement this using an approach similar to the one outlined in Mertens and Ravn (2013), in which we regress each of the residuals on a series that equals zero most of the time and becomes nonzero when there’s an exceptional change in overall implied volatility (equal to the values in the chart above). This then allows us to estimate risk-aversion shocks and to quantify within the model the impact of these shocks on asset prices.
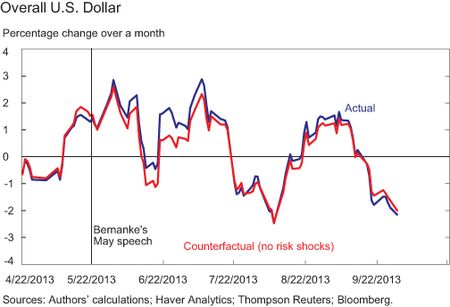
The chart below plots the percentage change on a given day over the previous month for an index of forty-five dollar exchange rates. The blue line is actual data and the red line is the counterfactual version where we use our estimated model to strip out the effect of shocks to global risk aversion. The red line thus shows how the dollar’s value would have changed had there been no change in risk aversion. The gap between the red and blue lines indicates the degree to which the change in risk aversion affected the change in the overall value of the dollar.
In the chart above, we marked Chairman Bernanke’s May 22 testimony to Congress as a key event that impacted global risk aversion. His discussion of tapering led to heightened uncertainty about the Federal Reserve’s commitment to accommodative monetary policy and appears to have lowered investor appetite for risky investments. The model suggests that increased risk aversion since May boosted the dollar modestly in June and July.
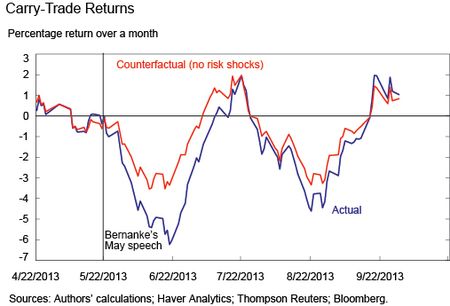
The chart below considers our second currency variable, which relates to carry-trade currencies. These currencies are those among the sample of forty-five dollar exchange rates that have the largest interest rate differential with one-month U.S. rates. The non-carry currencies are those with interest rates that are similar to or lower than U.S. rates. The carry-trade return is how much the basket of carry currencies appreciated relative to non-carry currencies over a month on a given day. The model results show that the drop in carry currencies has been accentuated by the increase in global risk aversion since May. Nearly half of the depreciation of carry currencies relative to non-carry currencies that occurred between the May 22 testimonial and early July was due to increased risk aversion, according to the model’s estimates.
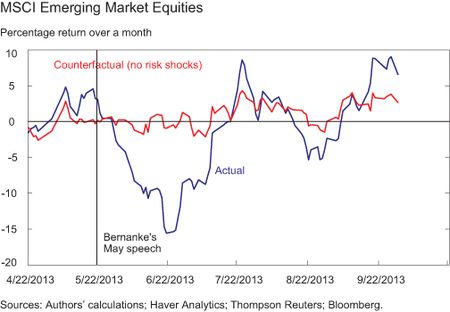
Finally, the next chart shows emerging market equity prices and attributes essentially all of the percentage changes in June and July to increases in global risk aversion.
By late August, risk-aversion shocks from May no longer affected prices according to the model, as the actual and counterfactual series converge in the previous three charts. Indeed, it appears that emerging market equities were supported by declines in global risk aversion in September, as the September Federal Open Market Committee meeting didn’t result in an announced tapering of asset purchases by the Fed.
Measuring changes to global risk aversion is a difficult exercise. The model used here suggests that substantial changes in risk aversion coincided with Chairman Bernanke’s May 22 testimony, resulting in substantial downward pressure on global asset prices in the two months after the May 22 testimony.
Disclaimer
The views expressed in this post are those of the authors and do not necessarily reflect the position of the Federal Reserve Bank of New York or the Federal Reserve System. Any errors or omissions are the responsibility of the authors.

Jan J.J. Groen is an officer in the Federal Reserve Bank of New York’s Research and Statistics Group.


 RSS Feed
 Follow Liberty Street Economics
Very intersting article. It is interesting that the “hangover” effect from the Bernanke announcement was 3 months. That is longer than any effect from any “fixed monthly” report like employment, Consumer Confidence, etc. The Continuing Resolution was signed in March, 2013, right before your data kicks in, but it appears that effect is already adjusted by April. I would not have expected that. Again, nice work.
Is there any weighting involved in averaging the VIX, MOVE, and JPM FX Vol Index?