Stavros Peristiani and João A.C. Santos
This post is the second in a series of six Liberty Street Economics posts on liquidity issues.
The recent financial crisis caused the largest rise in the number of bank failures since the unprecedented banking crisis of the 1980s and early 1990s. This post examines how depositors responded to the amplified risks of bank failure over the last three decades. We show that uninsured depositors discipline troubled banks by withdrawing their funds. Focusing on the recent financial crisis, we find that banks experienced an outflow of uninsured time deposits after the near-failure of Bear Stearns and bankruptcy of Lehman Brothers. This depositor risk sensitivity subsided after the Federal Deposit Insurance Corporation (FDIC) introduced the Transaction Guarantee Account program in October 2008, which raised the maximum deposit insurance limit from $100,000 to $250,000.
A Brief Overview of the U.S. Bank Failure Experience
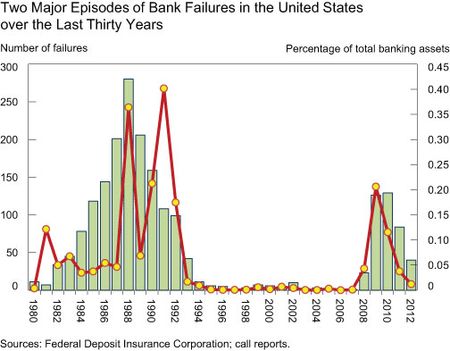
The U.S. banking sector experienced two major failure episodes over the last three decades. During the 1980s and early 1990s, broad deregulation of the banking and savings-and-loan sectors, increased competition from nonbanks, and regional real estate boom-and-bust cycles severely destabilized the banking system. Supervisory authorities and government policymakers took critical steps to restore the financial health of the banking sector by resolving over 1,600 failing commercial banks (see chart below).
Following the extraordinary upsurge in bank failures in the 1980s and early 1990s, the banking sector was relatively stable for about ten years. However, the sharp decline in housing prices that started in 2006 and the subsequent meltdown of the subprime mortgage sector severely weakened the banking system. With millions of homeowners defaulting on their home mortgages, U.S. banks suffered massive credit losses resulting in a significant rise in bank failures between 2008 and 2012.
Market Discipline of Failing Banks
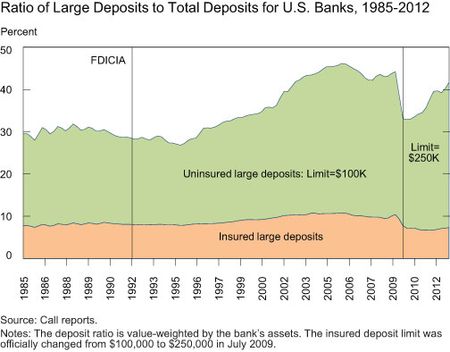
Depositors can be an important source of market discipline of bank risk-taking. While debtholders and shareholders can typically exert their influence on larger public banks, depositors are an important source of funding across all strata of banks, from small community banks to large, systemically important financial institutions. Uninsured depositors are particularly exposed to the risks of bank failure as they stand to lose a considerable amount of their unprotected deposit investment. Furthermore, as shown in the next chart, large depositors have become an important source of retail funding for banks; their share of total deposits rose from around 30 percent in the mid-1990s to over 45 percent by the mid-2000s.
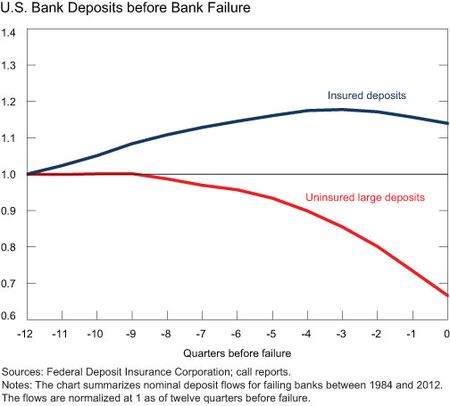
The following chart reveals the different responses of insured and uninsured depositors to those banks that eventually failed over the last three decades. Large, uninsured deposits experienced a significant runoff before failure that accelerated as failure got closer. In contrast, insured deposits were less responsive to failure; they actually grew two to three years before failure and declined slightly a few quarters before failure.
Bank Depositor Response during the Recent Financial Crisis
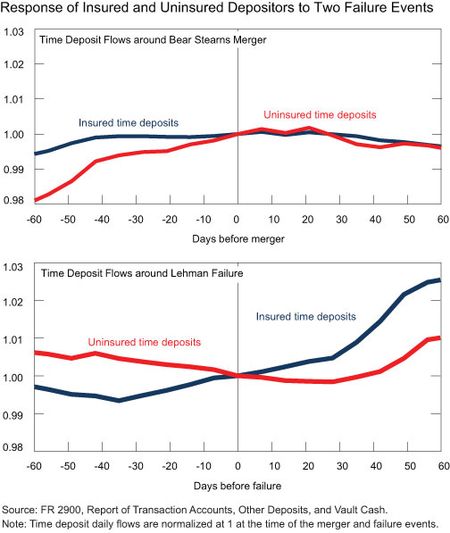
The previous chart reveals how uninsured depositors responded to the deterioration in the financial condition of banks that eventually failed. Yet their response isn’t limited to these bank-specific extreme cases of financial distress. The collapse of the subprime mortgage markets in 2008 triggered a broad financial crisis that threatened several large financial institutions. At the height of the crisis, Bear Stearns was hastily acquired by JPMorgan Chase and Lehman Brothers was forced to declare bankruptcy after failing to find a buyer. Following the Lehman bankruptcy, throughout the fall and winter of 2008 U.S. banks faced severe strains. The chart below traces the response of insured and uninsured depositors around the Bear Stearns and Lehman failure events.
Before the Bear Stearns collapse, banks experienced a modest inflow of insured and uninsured time deposits. Both trends, however, reversed around the time of the Bear Stearns merger. Interestingly, soon after that merger insured deposits began to rise again, but uninsured deposits continued to decline. These paths continued past the Lehman failure and only changed with the introduction of the FDIC’s Transaction Account Guarantee program, which increased deposit insurance coverage to $250,000, at which time insured deposits started to grow at a faster rate and uninsured deposits began to grow again.
Disclaimer
The views expressed in this post are those of the authors and do not necessarily reflect the position of the Federal Reserve Bank of New York or the Federal Reserve System. Any errors or omissions are the responsibility of the authors.

Stavros Peristiani is an assistant vice president in the Federal Reserve Bank of New York’s Research and Statistics Group.

João A.C. Santos is a vice president in the Research and Statistics Group.


 RSS Feed
 Follow Liberty Street Economics