Basit Zafar, Max Livingston, and Wilbert van der Klaauw
Total consumer debt continued to increase in the first quarter of this year, marking the first time since the recession that aggregate debt had grown for three consecutive quarters, according to the May 2014 Quarterly Report on Household Debt and Credit. Is this increase in household debt driven by changes in supply or demand? The January 2014 and April 2014 Senior Loan Officer Opinion Surveys (SLOOS) show an increase in lenders’ willingness to make consumer loans over the last several quarters and an increase in the number of lenders reporting looser lending standards, which indicates that credit supply is increasing. To get a better sense of the underlying factors in the evolution of household credit conditions, in February we surveyed 1,110 respondents of the New York Fed’s Survey of Consumer Expectations (SCE) about their ability to obtain credit over the past twelve months and their expectations about future credit access.
Past Experiences
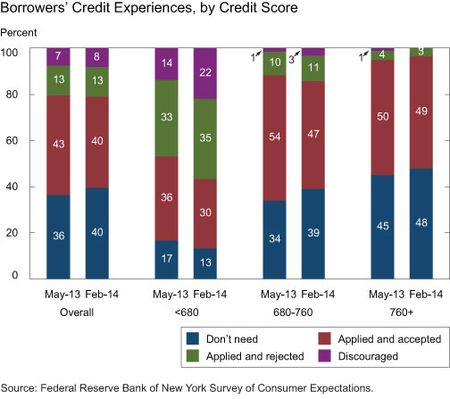
To assess the demand for credit and measure how much of that demand was met, we classify our respondents into four groups. In February 2014, 40 percent of respondents reported not applying for any type of credit over the past twelve months because they didn’t need it (satisfied consumers); 40 percent of respondents reported applying for some type of credit and being approved (accepted applicants); 13 percent reported applying for some type of credit and being rejected (rejected applicants); and 8 percent reported not applying for credit despite needing it because they believed they would not be approved. This last group represents latent demand for credit; we refer to them as discouraged consumers. The leftmost two bars in the chart below show that the distribution of respondents in February 2014 looked quite similar to that in May 2013 (the results of which we discussed in a previous post): we see a slight increase in satisfied consumers from May to February and a slight decrease in accepted applicants. Note that the SCE is a rotating panel, so the respondents in the two surveys will be different; however, we use weights to ensure that the statistics reported in this post remain representative of the population of U.S. household heads.
The picture, however, varies radically when split by credit score. The chart above shows that individuals with lower credit scores (those with credit scores below 680) were more likely to report that they were rejected, and much more likely to report that they were discouraged, than their more creditworthy counterparts. In February, 22 percent of respondents in the low-credit-score group were discouraged, versus 3 percent in the middle-credit-score group, and zero percent in the high-credit-score group (those with scores of above 760). Furthermore, the chart shows that credit experiences got markedly worse for the low-credit-score group in February 2014 compared with May 2013: 57 percent of this group reported either being denied credit or being too discouraged to apply in February this year, versus 47 percent in May of last year. This result contrasts with the experiences of their more creditworthy counterparts, which were largely unchanged since May 2013. These patterns suggest that although banks may be increasing their lending activity, they are not necessarily taking on more risk, as the risky population has not seen an improvement in its ability to obtain credit.
Past Experiences with Specific Credit
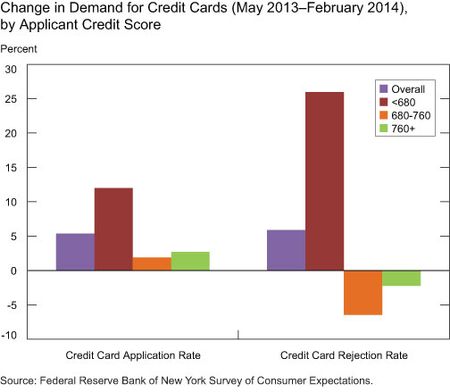
Our data allow us to investigate what types of credit respondents applied for and how successful they were in obtaining credit. For illustration, we focus on credit card and purchase mortgage (as well as home equity loan and line of credit) applications. In the chart below, we show the change in application and rejection rates for credit cards from May 2013 to February 2014. Generally, credit card application rates increased by 5 percentage points over this period, while rejection rates increased by 6 percentage points. Looking at the changes by credit score, we see that while demand for credit cards increased for each of the risk groups, the increase was largest for the highest-risk group (an increase of 12 percentage points in the application rate since May 2013). Interestingly, we see that while rejection rates for credit cards decreased for the lower-risk groups since May 2013, they in fact increased by 26 percentage points for the highest-risk group.
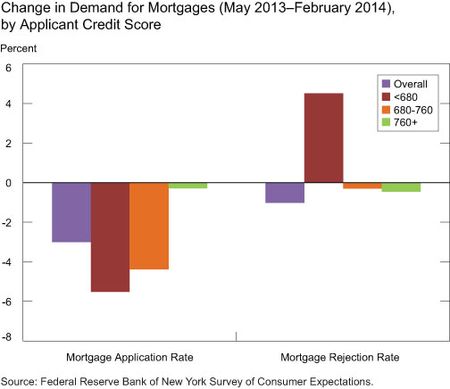
Alternatively, looking at changes in demand for mortgages and home loans in the chart below, we see a fall in applications across all credit groups, particularly the lower two risk groups. This decline is likely a result of rising mortgage interest rates. As was the case for credit cards, the riskiest respondents experienced rising rejection rates, while the less risky groups saw a slight decline in their rejection rates.
The patterns in the data indicate increased demand for nonhousing debt since May 2013. However, credit access seems to have improved only for those with good credit histories.
Expectations for Future Credit Access
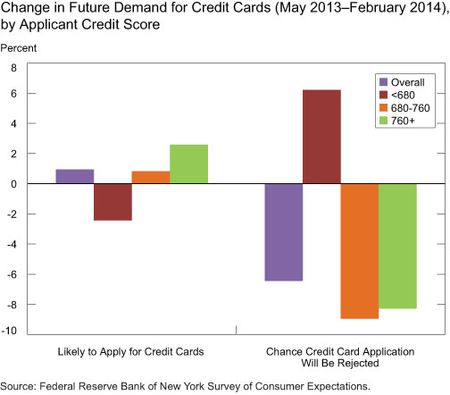
We next turn to consumers’ expectations about their future credit access. Respondents were asked whether it is likely that they will apply for each type of credit over the next twelve months. Those who reported that they are at least somewhat likely to apply were then asked to gauge how likely it was that their application would be approved. The chart below shows that, relative to the May 2013 survey respondents, February 2014 respondents report that they are more likely to apply for credit cards over the next twelve months, and they expect a lower rejection rate. However, once we cut the data by respondents’ risk scores, stark differences again emerge. Lower-risk respondents report that they are more likely to apply for credit cards in the future (than low-risk respondents were in the May survey), and are much more optimistic about their chances of approval. Higher-risk respondents, instead, are less likely to apply and believe they are more likely to be denied (compared with the May 2013 survey).
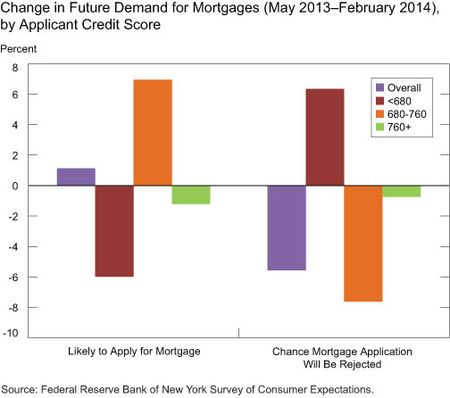
The chart below shows that respondents’ future expectations about mortgages and home loans follow a pattern similar to their credit card expectations. Survey respondents in February 2014 reported that they are more likely to apply for housing loans over the next twelve months, and they expect lower rejection rates than May 2013 respondents. The high-risk group is increasingly pessimistic: compared with levels in the May 2013 survey, they report that they are less likely to apply for these loans by 6 percentage points, and, conditional on applying, expect a 6 percentage point higher rejection rate. The chart also shows significant improvement in the expectations for the middle-credit-risk group, which reported being much more likely to apply for credit in the coming year and believed they were much more likely to be approved (relative to May 2013). While not shown here, we see very similar changes in future expectations about auto loans.
Conclusion
We have shown that aggregate patterns in credit experiences and expectations mask substantial heterogeneity among consumers. As of February 2014, while customers with better credit seem to be faring better in terms of both their experiences (with lower reported rejection rates over the past year) and more optimistic expectations for the future, credit access seems to have worsened for higher-risk borrowers since last year. These borrowers are more likely to be discouraged, to report higher credit denial rates, and to be quite pessimistic in their expectations for future access to credit.
Our results are certainly not consistent with lenders taking more risk, and suggest that recent findings from the New York Fed’s Quarterly Report on Household Debt and Credit of decreased balances (particularly for mortgages and credit cards) among borrowers with worse credit are possibly, in part, owing to supply-side factors.
At the same time, we find that consumers, particularly those with bad credit, continue to be constrained and to report significant credit needs. According to our February 2014 survey, 51 percent of the high-risk borrowers have maxed out a credit card in the past year, compared with less than 20 percent for the lower-risk groups. Nineteen percent of them are more than thirty days delinquent on a loan, compared with just 2 percent for the lower-risk groups. These numbers provide some indication of why lenders are reluctant to extend credit to these individuals. That high-risk borrowers are having a difficult time obtaining credit does not necessarily mean that there is a problem in the credit market—in fact, it could be a sign that the credit market is functioning properly. Lenders, after all, are supposed to ration credit based on borrower’s demonstrated willingness and ability to repay their debts, and that is what the data indicate.
Disclaimer
The views expressed in this post are those of the authors and do not necessarily reflect the position of the Federal Reserve Bank of New York or the Federal Reserve System. Any errors or omissions are the responsibility of the authors.

Basit Zafar is a senior economist in the Federal Reserve Bank of New York’s Research and Statistics Group.

At the time this post was written, Max Livingston was a research analyst in the Bank’s Research and Statistics Group.

Wilbert van der Klaauw is a senior vice president in the Bank’s Research and Statistics Group.


 RSS Feed
 Follow Liberty Street Economics